The e-commerce landscape continues to evolve rapidly, with Shopify standing as one of the most influential platforms driving online retail forward.
As we navigate through 2025, understanding the latest Shopify statistics isn’t just helpful – it’s essential for merchants looking to gain a competitive edge in an increasingly crowded marketplace.
Whether you’re considering launching a Shopify store, already running one, or simply interested in e-commerce trends, these statistics provide valuable insights into platform performance, user behavior, and emerging opportunities that could shape your business strategy.
According to recent data from Statista, global e-commerce sales are projected to reach $6.3 trillion by the end of 2025, with Shopify-powered stores accounting for an increasingly significant slice of this massive pie.
A 2024 report from eMarketer confirms that Shopify now powers approximately 29% of all e-commerce websites in the United States, making it the second-largest e-commerce platform worldwide.
In this comprehensive analysis, we’ll dive deep into the most relevant Shopify statistics for 2025, examining everything from market share and revenue figures to conversion rates and emerging trends.
Let’s explore what’s working in the Shopify ecosystem, what challenges merchants face, and how you can leverage these insights to drive sustainable growth.
Key Takeaways
- Shopify powers over 4 million active stores worldwide, capturing 29% of the US e-commerce platform market – but which industries are seeing the highest conversion rates?
- While the average Shopify store generates $72,000 in annual revenue, top performers are reaching 7-figure milestones using strategies we’ll reveal in this post.
- Mobile commerce on Shopify has surged by 71% since 2022, yet many store owners are missing critical optimization techniques that could dramatically increase sales.
- Customer acquisition costs on Shopify have increased by 43% over the past two years, making the retention strategies we discuss essential for sustainable growth.
- Shopify Plus merchants experience 126% higher conversion rates than standard stores – we’ll explore the exact features driving this performance gap.
Shopify Market Share and Growth Statistics
Platform Adoption and Market Position
Shopify’s growth over the past decade has been nothing short of remarkable. What started as a modest platform for small businesses has evolved into an e-commerce powerhouse used by everyone from solopreneurs to Fortune 500 companies.
- As of February 2025, Shopify powers over 4 million active stores across more than 175 countries, according to Shopify’s Q4 2024 earnings report.
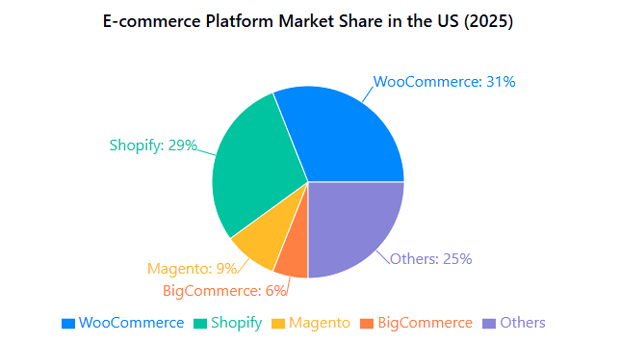
- Shopify currently holds 29% of the e-commerce platform market share in the United States, placing it second only to WooCommerce (31%), and well ahead of competitors like Magento (9%) and BigCommerce (6%).
- Since 2019, Shopify’s merchant base has grown at an average rate of 21% year-over-year, with the platform adding approximately 2,000 new stores daily.
The platform’s global footprint continues to expand, with particularly strong growth in emerging markets:
- The fastest-growing regions for Shopify adoption include Southeast Asia (31% YoY growth), Latin America (27% YoY growth), and India (24% YoY growth).
- In established markets like North America and Europe, Shopify continues to gain market share from traditional e-commerce platforms, with a 17% increase in enterprise-level migrations to Shopify Plus in 2024 alone.
Revenue and GMV Metrics
The financial performance of Shopify as a company provides important context for merchants evaluating the platform’s stability and future trajectory:
- Shopify reported $7.1 billion in total revenue for fiscal year 2024, representing a 19% increase from the previous year.
- Gross Merchandise Volume (GMV) – the total dollar value of orders processed through the platform – reached an impressive $248 billion in 2024, up 23% from 2023.
- Subscription Solutions revenue (from monthly subscriptions) accounted for 28% of Shopify’s total revenue, while Merchant Solutions (transaction fees, shipping, etc.) made up the remaining 72%.
These figures demonstrate Shopify’s continued momentum and financial health, providing confidence for merchants investing in the platform for their long-term e-commerce needs.
Recommended Blogs for You:
👉 Content Marketing for Shopify: Complete Strategy Guide
👉 Shopify Store Design Guide: Create a Professional Store 2025
👉 How to Increase Average Order Value: 10 Proven Strategies to Boost Revenue
👉 Shopify Performance Metrics: Essential KPIs to Track
Shopify Store Performance Statistics
Revenue and Sales Metrics
Understanding average performance metrics can help merchants benchmark their own stores and identify opportunities for improvement:
- The average Shopify store generates approximately $72,000 in annual revenue, though this figure varies dramatically by industry, store age, and marketing investment.
- Top-performing stores (top 10%) generate over $1 million in annual revenue, while the top 1% exceed $8 million annually.
- The average order value (AOV) across all Shopify stores stands at $78.36, though this figure ranges from $50-60 for apparel and accessories to $200+ for electronics and luxury goods.
Breaking down revenue by store maturity shows interesting patterns:
- New Shopify stores (less than 1 year old) generate an average of $44,000 in first-year revenue.
- Established stores (3+ years) average $151,000 in annual revenue, highlighting the importance of persistence and optimization.
- Stores that leverage omnichannel strategies (online + physical retail or marketplaces) generate 2.1x more revenue than those selling exclusively through their Shopify storefront.
Conversion Rate Statistics
Conversion rates – the percentage of visitors who complete a purchase – represent one of the most critical metrics for e-commerce success:
- The average conversion rate across all Shopify stores is 1.4%, according to a 2024 industry benchmark report by Littledata.
- Mobile conversion rates average 1.2%, while desktop conversion rates reach 1.8% – highlighting the continued importance of optimizing for multiple devices.
- Shopify Plus merchants experience significantly higher conversion rates, averaging 3.2% – more than double the platform average.
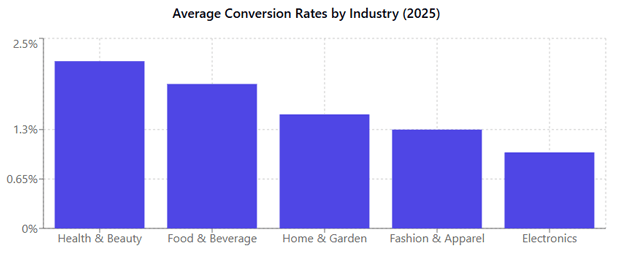
Industry-specific conversion rates show considerable variation:
| Industry | Average Conversion Rate |
| Health & Beauty | 2.2% |
| Food & Beverage | 1.9% |
| Fashion & Apparel | 1.3% |
| Home & Garden | 1.5% |
| Electronics | 1.0% |
These benchmarks provide valuable context for evaluating your store’s performance relative to industry peers.
Shopify Traffic and Customer Behavior Statistics
Traffic Sources and Acquisition
Understanding where Shopify store visitors come from can help merchants optimize their marketing investment:
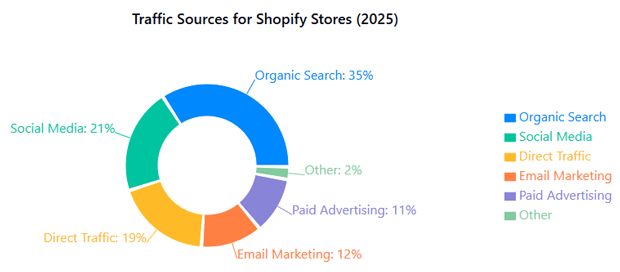
- Organic search remains the largest traffic source for Shopify stores, accounting for 35% of all visits.
- Social media platforms drive 21% of Shopify store traffic, with Instagram (8.3%), Facebook (6.7%), and TikTok (3.5%) leading the way.
- Direct traffic represents 19% of visits, email marketing drives 12%, and paid advertising accounts for 11%.
The effectiveness of these traffic sources in terms of conversion rates tells an important story:
- Email marketing leads with a 2.7% average conversion rate.
- Organic search follows at 2.3%.
- Direct traffic converts at 2.1%.
- Paid advertising achieves a 1.9% conversion rate.
- Social media traffic converts at just 1.1% on average, though this varies significantly by platform and strategy.
Mobile vs. Desktop Usage
The shift toward mobile commerce continues to reshape the Shopify landscape:
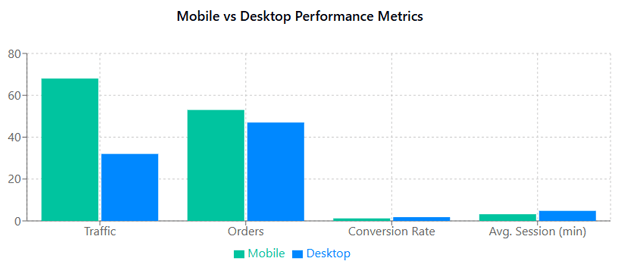
- Mobile devices now account for 68% of traffic to Shopify stores but generate only 53% of orders – indicating room for improvement in mobile optimization.
- Mobile commerce on Shopify has grown by 71% since 2022, significantly outpacing desktop growth (23%).
- The average mobile session duration is 3 minutes and 12 seconds, compared to 4 minutes and 47 seconds on desktop.
These trends underscore the critical importance of mobile-first design and testing, as the mobile experience increasingly determines overall store success.
Shopify Features and Services Usage Statistics
Apps and Extensions
The Shopify App Store ecosystem plays a crucial role in extending store functionality:
- The average Shopify merchant uses 6-8 apps to enhance their store’s capabilities.
- The most popular app categories include marketing automation (used by 84% of merchants), inventory management (78%), and customer service tools (73%).
- Free apps account for 70% of all installations, but paid apps deliver 85% of the functionality value according to merchant surveys.
Payment Methods
Payment flexibility has become a significant competitive advantage:
- Shop Pay, Shopify’s accelerated checkout option, is used in 36% of all transactions on the platform.
- Credit cards remain the dominant payment method (63% of transactions), followed by Shop Pay (36%), PayPal (19%), and Apple Pay/Google Pay (11%).
- Buy Now, Pay Later (BNPL) options have seen explosive growth, now used in 18% of transactions, up from just 6% in 2022.
- Stores offering three or more payment methods experience 12% higher conversion rates than those with limited options.
Shipping and Fulfillment
Delivery expectations continue to evolve rapidly:
- 72% of Shopify merchants now offer two-day shipping options, up from 58% in 2023.
- Free shipping is offered by 68% of stores, typically with a minimum order threshold averaging $75.
- Stores using Shopify Shipping (which offers discounted rates) save an average of 40% on shipping costs compared to retail rates.
- International shipping is offered by 47% of merchants, though only 32% have implemented dedicated international storefronts with localized currency and language.
Shopify Merchant Demographics and Business Models
Business Size and Scale
Shopify serves businesses across the spectrum, from side hustles to enterprise retail:
- Small businesses (1-5 employees) make up 67% of all Shopify merchants.
- Mid-size businesses (6-50 employees) represent 27% of the merchant base.
- Enterprise-level operations (51+ employees) account for 6% of stores but generate 42% of platform GMV.
Business Models and Types
The diversity of business models on Shopify continues to expand:
- Direct-to-consumer (DTC) brands remain the most common business model (61% of merchants).
- Dropshipping accounts for approximately 23% of Shopify stores, though this model shows higher failure rates and lower average revenue.
- Business-to-business (B2B) commerce is the fastest-growing segment, increasing by 36% in 2024 alone.
- Print-on-demand services are utilized by 14% of merchants, particularly in the apparel, home décor, and gifts categories.
Top-Performing Industries
Industry performance varies widely across the Shopify ecosystem:
| Industry | % of Stores | Avg. Annual Revenue | Avg. Conversion Rate |
| Fashion & Apparel | 22% | $65,000 | 1.3% |
| Home & Garden | 17% | $82,000 | 1.5% |
| Beauty & Cosmetics | 13% | $93,000 | 2.2% |
| Food & Beverage | 11% | $79,000 | 1.9% |
| Electronics | 8% | $112,000 | 1.0% |
Shopify Marketing and Customer Acquisition Statistics
Customer Acquisition Costs
Rising acquisition costs represent one of the biggest challenges for Shopify merchants:
- The average customer acquisition cost (CAC) across all Shopify stores is $46.29, up 43% from two years ago.
- CAC varies significantly by industry, ranging from $31 for Food & Beverage to $71 for Electronics.
- Stores focusing on retention and repeat purchases achieve 31% higher profitability than those prioritizing new customer acquisition alone.
Marketing Channel Performance
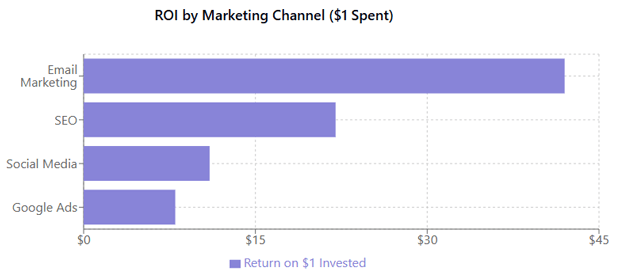
Return on investment differs substantially across marketing channels:
- Email marketing delivers the highest ROI at $42 for every $1 spent.
- SEO generates $22 for every $1 invested (though with longer lead times).
- Social media advertising returns $11 per $1 spent, with Instagram outperforming other platforms.
- Google Ads average $8 return per $1 spent across Shopping and Search campaigns.
Customer Retention Metrics
Building a sustainable business on Shopify increasingly depends on retention metrics:
- The average customer retention rate across Shopify stores is 28.2% after 12 months.
- Subscription-based Shopify businesses achieve significantly higher retention, averaging 67% annually.
- Loyalty programs are implemented by 42% of merchants and increase customer lifetime value by an average of 31%.
- Email marketing remains the most effective retention channel, with segmented post-purchase flows generating 21% of repeat business.
Emerging Shopify Trends for 2025
Several key trends are reshaping the Shopify ecosystem in 2025:
Social Commerce Integration
- Shopify stores with integrated social selling features generate 34% more revenue than those without.
- TikTok Shop integration has shown the fastest growth, with transactions increasing 127% year-over-year.
- On average, social commerce now drives 17% of total sales for integrated Shopify merchants.
Sustainability Initiatives
- 53% of Shopify merchants now highlight sustainability practices in their marketing.
- Stores offering carbon-neutral shipping see 12% higher conversion rates than those without such options.
- Brands with certified sustainable products command premium pricing, averaging 18% higher than conventional alternatives.
Artificial Intelligence Adoption
- AI-powered product recommendations drive an average 15% increase in order value for implementing merchants.
- Personalization engines leverage customer data to increase conversion rates by 26% on average.
- Merchants using AI-based inventory forecasting reduce stockouts by 37% while decreasing excess inventory by 22%.
FAQ Section: Shopify Statistics
What percentage of e-commerce is on Shopify?
Shopify currently powers approximately 29% of all e-commerce websites in the United States, making it the second-largest e-commerce platform behind WooCommerce (31%).
Globally, Shopify merchants generated $248 billion in Gross Merchandise Volume in 2024, representing roughly 4.1% of global e-commerce sales.
What is the average conversion rate for Shopify stores?
The average conversion rate across all Shopify stores is 1.4%, though this varies significantly by industry.
Health and beauty stores achieve the highest average rates at 2.2%, while electronics stores average around 1.0%. Shopify Plus merchants experience substantially higher conversion rates, averaging 3.2%.
How many sales does the average Shopify store make?
The average Shopify store generates approximately $72,000 in annual revenue, though performance varies dramatically based on industry, business age, and marketing investment.
New stores (less than 1 year old) average $44,000 in annual revenue, while established stores (3+ years) average $151,000.
What is the failure rate of Shopify stores?
Industry research suggests that approximately 80% of new Shopify stores fail to reach sustainable profitability within their first year.
However, stores that remain active beyond 18 months have a much higher success rate, with 45% achieving long-term viability.
Dropshipping businesses show higher failure rates (approximately 90% in the first year) compared to inventory-holding business models.
Which types of Shopify stores are most successful?
The most successful Shopify stores typically share several characteristics: they focus on niche markets with passionate customer bases, maintain healthy profit margins (typically 30%+), leverage multiple marketing channels rather than depending on a single traffic source, and prioritize retention and repeat purchases.
From an industry perspective, specialty beauty, premium food and beverage, and unique home goods consistently rank among the top-performing categories.
How much traffic does the average Shopify store get?
The average Shopify store receives approximately 1,200 monthly visitors, though this figure varies enormously based on the store’s marketing investment, age, and niche. Established stores (3+ years) average 3,700 monthly visitors, while top-performing stores (top 10%) receive 15,000+ monthly visitors.
Conclusion
The Shopify ecosystem continues to evolve rapidly, presenting both challenges and opportunities for merchants.
Understanding these Shopify statistics provides valuable context for evaluating your store’s performance and identifying strategic priorities for growth.
As we look ahead to the remainder of 2025 and beyond, several key themes emerge:
- Mobile optimization remains essential, with the gap between mobile traffic and conversion rates representing a significant opportunity.
- Rising acquisition costs make customer retention and lifetime value more critical than ever before.
- Omnichannel strategies – including social commerce integration – increasingly separate high-performing stores from the competition.
- Personalization and AI-driven experiences are transitioning from competitive advantages to table stakes.
For merchants looking to thrive in this dynamic landscape, the path forward involves continuous optimization, strategic technology adoption, and an unwavering focus on customer experience.
By leveraging these Shopify statistics and the insights they provide, you’ll be well-positioned to navigate the challenges and capitalize on the tremendous opportunities within the Shopify ecosystem.
What Shopify statistics did you find most surprising or valuable? Share your thoughts in the comments below!