Opening a Google Ads dashboard for the first time feels like walking into the cockpit of a jet plane. There are hundreds of columns, flashing numbers, and endless graphs. If you try to watch everything, you’ll crash.
The secret to success isn’t tracking more data; it’s tracking the right data. Whether you are a Shopify merchant selling apparel or a local service provider, ignoring vanity metrics in favor of revenue-driving KPIs (Key Performance Indicators) is the only way to scale.
In this guide, we will cut through the noise and teach you exactly which metrics belong in your performance report and how to use them to increase profitability.
If you only have 5 minutes a week to analyze your account, focus on these five metrics. They provide the clearest picture of your financial health:
- ROAS (Return on Ad Spend): Are you making money?
- CPA (Cost Per Acquisition): How much does it cost to buy a customer?
- Conversion Rate: Is your website persuasive enough?
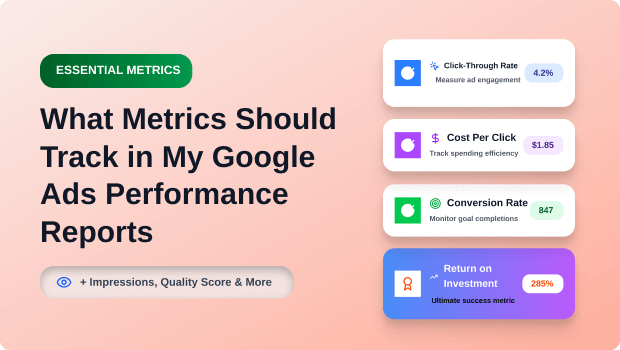
- CTR (Click-Through Rate): Is your ad copy relevant?
- Quality Score: Are you overpaying for clicks?
Key Takeaways
- Profit over Traffic: Prioritize conversion metrics (ROAS, CPA) over traffic metrics (Impressions, Clicks).
- Context is King: A low CTR isn’t always bad if your Conversion Rate is high. Metrics must be viewed in relation to one another.
- Segmentation Matters: Device, location, and time-of-day performance can drastically change which metrics look “good.”
- Quality Score Saves Money: Improving this hidden metric directly lowers your Cost Per Click (CPC).
Overview of the Task
We are going to build a mental (and literal) framework for your Google Ads reporting. Instead of accepting the default columns Google provides, we will identify the specific data points that align with business growth.
Why this matters:
If you optimize for Clicks, you might get thousands of visitors who never buy. If you optimize for Conversions, you get sales. Tracking the wrong metric is the fastest way to burn budget.
Prerequisites
Before you can track these metrics effectively, ensure you have the following in place:
- Active Google Ads Account: With at least 30 days of historical data (preferred for accurate analysis).
- Conversion Tracking Installed: This is non-negotiable. You must have Google Ads tags or Google Analytics 4 (GA4) linked to track purchases, form fills, or calls.
- Tip: For Shopify users, ensure your purchase data layer is accurate.
- Value Tracking: Pass the dynamic revenue value of the purchase back to Google Ads (essential for ROAS).
Read: Google Ads Attribution Confusion? Get Clarity with Comprehensive Performance Reports
The Metrics You Must Track for Your Google Ads
We will break these down into three tiers: Financial Health, Ad Relevance, and Competitive Visibility.
Step 1: Track Financial Health (The “Money” Metrics)
These are your bottom-line indicators. If these are red, nothing else matters.
- ROAS (Return on Ad Spend):
- What it is: The revenue generated for every dollar spent.
- Formula:
$$ROAS = \frac{\text{Revenue from Ads}}{\text{Cost of Ads}} \times 100\%$$ - Why track it: It tells you if your campaigns are profitable. For e-commerce, a ROAS of 400% (4:1) is often the standard target.
- CPA (Cost Per Acquisition):
- What it is: The average amount you pay to get a conversion (sale or lead).
- Why track it: It determines your margin. If your product profit margin is $50, and your CPA is $60, you are losing money on every sale.
- Conversion Rate (CvR):
- What it is: The percentage of clicks that result in a sale.
- Why track it: This measures the effectiveness of your landing page, not just your ad. If you have high clicks but low conversions, your website is likely the bottleneck.
Recommended Blogs for You:
👉 How to Optimize Your Google Ads Without Hiring an Expert
👉 Shopify Mobile Advertising: Boost ROAS with Simplified Device Reports
👉 Mastering Geo and Device Data for Google Ads
👉 GA4 Marketing ROI: The Expert’s 7-Step Framework for Budget Optimization
Step 2: Track Ad Relevance (The “Traffic” Metrics)
These metrics diagnose the health of your account before the user buys.
- CTR (Click-Through Rate):
- What it is: The percentage of people who see your ad and click it.
- Benchmark: Search ads usually aim for 3–5%+.
- Why track it: A low CTR indicates your ad copy is boring or not relevant to the keyword searched.
- CPC (Cost Per Click):
- What it is: The actual price you pay for a visitor.
- Why track it: Rising CPCs can indicate increased competition or a dropping Quality Score.
- Quality Score:
- What it is: Google’s rating (1–10) of your keyword, ad relevance, and landing page experience.
- Why track it: This is critical. A score of 10/10 gives you a discount on every click. A score of 3/10 acts as a penalty, forcing you to pay more than competitors to show up in the same spot.
Step 3: Track Competitive Visibility
Are you actually showing up?
- Search Impression Share:
- What it is: The percentage of times your ad showed up compared to the total number of times it could have shown up.
- Why track it: If your impression share is 50%, you are missing half the potential market, usually due to low budget or low ad rank.
- Lost IS (Budget) vs. Lost IS (Rank):
- Why track it: This tells you why you missed out.
- Lost (Budget): You need to spend more money.
- Lost (Rank): You need better ads or a higher bid.
Advanced Options: The “Pro” Level Metrics
Once you have mastered the basics, add these columns to your report for deeper insights:
| Metric | Purpose | Best For |
| Search Abs. Top IS | Tells you how often you are the very first ad (position #1). | Brand awareness & aggressive growth. |
| View-Through Conv. | Tracks users who saw an ad, didn’t click, but bought later. | Display & Video campaigns. |
| Customer LTV | Total revenue expected from a customer over their lifetime. | Subscription businesses (SaaS, Coffee). |
| Attribution Paths | Shows if a generic keyword assisted a branded keyword conversion. | High-budget accounts with complex funnels. |
Common Errors & Fixes
1. Tracking “Vanity” Metrics
The Error: Obsessing over Impressions.
The Fix: You can’t pay rent with impressions. Use impressions only to verify that a campaign is actually running, but never use it as a success metric unless your goal is pure brand awareness.
2. Ignoring Search Terms
The Error: Looking only at keyword performance, not the actual search terms users typed.
The Fix: Regularly check your “Search Terms” report. You might find you are paying for irrelevant queries (e.g., selling “luxury tables” but paying for “free table plans”). Add these as Negative Keywords.
3. Looking at Global Averages
The Error: Panicking because your CPA increased, without realizing mobile traffic CPA dropped while desktop increased.
The Fix: Always segment your data. Use the “Segment” button in Google Ads to view performance by Device, Network, or Time of Day.
Example Implementation
Let’s look at a real-world scenario for a Shopify store selling hiking boots.
Scenario: The merchant spends $1,000/month.
- Revenue: $4,000
- Clicks: 500
- Conversions: 40
The Report Analysis:
- ROAS: $4,000 / $1,000 = 400% (4.0). Status: Healthy.
- CPA: $1,000 / 40 = $25.00. Status: Good (assuming boots profit >$25).
- CPC: $1,000 / 500 = $2.00.
- Conversion Rate: 40 / 500 = 8%. Status: Excellent.
Action: The merchant sees that ROAS is high and Conversion Rate is excellent. They should check Search Impression Share. If it is below 90% due to budget, they can safely increase the budget to scale sales, knowing the unit economics work.
Want Google Ad Copy That Drives More Sales?
Generates ready-to-use, conversion-focused Google Ads tailored to your products and goals.
Frequently Asked Questions
What is the most important metric in Google Ads?
For most businesses, ROAS (Return on Ad Spend) or CPA (Cost Per Acquisition) are the most important. These metrics directly correlate to profitability. If you are focused purely on brand awareness, then Impressions and Reach take priority.
What is a good Click-Through Rate (CTR)?
A “good” CTR varies by industry, but generally, a CTR of 3% to 5% is considered solid for Search Network campaigns. For Display Network ads, a CTR of 0.5% to 1% is standard.
How do I lower my Cost Per Click (CPC)?
The most effective way to lower CPC is to improve your Quality Score. By increasing ad relevance and improving your landing page experience, Google rewards you with lower costs for the same ad position.
Why do my Google Ads clicks not match my Analytics sessions?
Discrepancies are normal. Clicks measure ad server requests, while Sessions measure successful page loads. Differences occur due to slow page load speeds, users hitting “back” immediately, or cookie consent blockers preventing Analytics from firing.
Should I track “All Conversions” or just “Conversions”?
Track the “Conversions” column for optimization. “All Conversions” may include lower-value actions (like viewing a page) that you don’t want your bidding algorithm to target aggressively.
Conclusion
Tracking the right metrics in Google Ads is the difference between gambling and investing. By stripping away the clutter and focusing on ROAS, CPA, and Quality Score, you gain control over your budget.
Remember, data is only useful if it leads to action. If a metric doesn’t help you decide whether to increase a bid, change an ad, or fix a landing page, remove it from your dashboard.