If your Shopify store’s mobile traffic is 70% of your visitors but only 40% of your revenue, you’re not alone—and you’re leaving money on the table.
In 2025, mobile is no longer a secondary screen; it’s the primary storefront. Yet, most merchants treat their device data as an afterthought, leading to wasted ad spend on mobile clicks that never convert.
As a Senior SEO Strategist, I’ve seen this flaw derail otherwise solid campaigns. This tutorial cuts through the noise. You will learn the exact steps to analyze device performance data and apply strategic mobile bid adjustments that can instantly boost your return on ad spend (ROAS).
To master mobile-first advertising on Shopify, you must efficiently analyze the CPA (Cost Per Acquisition) and ROAS (Return on Ad Spend) for Mobile, Desktop, and Tablet.
The fastest way to do this is by using a dedicated Shopify app, like AdTrack ‑ Google Ads Tracking, which unifies complex Google Ads metrics and your Shopify revenue data into a single, simple device report.
If Mobile CPA is significantly higher, implement a negative mobile bid adjustment to re-allocate budget to devices that convert more efficiently, thus lowering your blended CPA and boosting ROAS.
The Mobile Conversion Rate Disconnect
The task is simple: stop bidding equally on unequal traffic quality.
In e-commerce, mobile is generally responsible for the majority of traffic, but desktop often dominates conversions due to better screen real estate for complex checkout processes. This creates the Mobile Conversion Rate Disconnect.
Your goal is to shift from a “set it and forget it” campaign to a device-aware strategy. This starts by identifying the device (Mobile, Desktop, Tablet) that provides the lowest Cost Per Acquisition (CPA) and then strategically reducing bids on the devices with the highest CPA to re-invest budget where it drives the highest ROAS.
Key Metric Focus: CPA by Device (Calculated as Total Cost / Conversions) and ROAS by Device (Calculated as Revenue / Cost).
Want Google Ad Copy That Drives More Sales?
Generates ready-to-use, conversion-focused Google Ads tailored to your products and goals.
Ensuring Accurate Device Tracking
Before you analyze any shopify mobile advertising data, you must confirm your tracking is flawless. Garbage in, garbage out.
2.1. Verify Your Google Ads Conversion Action
Ensure your Google Ads conversion tracking tag is installed via the Sales Channel in Shopify and is set to track the Purchase event.
2.2. Link Google Analytics 4 (GA4)
Confirm your GA4 property is correctly integrated with your Shopify store and linked to your Google Ads account.
2.3. Check Mobile Page Speed
A slow mobile site invalidates any data analysis. Use Google’s PageSpeed Insights to ensure your mobile speed score is green, as a poor user experience is often the root cause of a low mobile conversion rate.
Recommended Blogs for You:
👉 Google Ads Attribution Confusion? Get Clarity with Comprehensive Performance Reports
👉 How to Setup Enhanced Conversions in Google Ads
👉 Event Match Quality Explained: How to Get a Score of 8+ on Every Event
Simplified Device Data Analysis & Optimization
The traditional method involves manually stitching together data from Google Ads and Shopify Analytics—a process that is time-consuming and error-prone. We recommend a simplified approach using a specialized reporting tool like AdTrack ‑ Google Ads Tracking.
Why AdTrack Streamlines This Process
To calculate true ROAS and CPA by device, you need Google Ads Cost data and Shopify Revenue data side-by-side. Your app, AdTrack, automatically unifies these two critical datasets, eliminating the need for complex interface navigation and spreadsheet exports.
Step 1: Access the Unified Device Report in AdTrack
- Install AdTrack ‑ Google Ads Tracking from the Shopify App Store.
- Connect your Google Ads account within the app setup.
- Navigate directly to the Ad Report section
- Select the Device Performance tab.
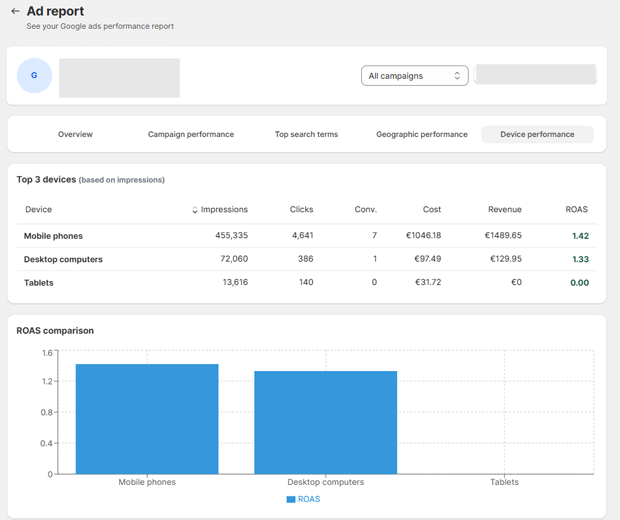
This single view instantly gives you the necessary metrics: Impressions, Clicks, Conversions (Conv.), Cost, Revenue, and the crucial ROAS.
Step 2: Identify the Conversion & ROAS Disconnect
Review the unified data to find the devices where your spending is inefficient.
- Analyze the CPA (Cost / Conv.): Divide the Cost by Conv. for each device.
- Analyze the ROAS (Revenue / Cost): The higher the number, the more efficient the device is at generating profit.
Example Analysis (from the image):
- Mobile Phones: ROAS is 1.42 (€1489.85 Revenue / €1046.18 Cost).
- Desktop Computers: ROAS is 1.33 (€129.95 Revenue / €97.49 Cost).
- Tablets: ROAS is 0.00 (0 Conversions / €31.72 Cost).
Actionable Insight: While Mobile has the highest volume and slightly better ROAS than Desktop, Tablets are completely inefficient and must be addressed first.
Step 3: Calculate and Apply Bid Adjustments in Google Ads
The insights from AdTrack now guide your actions directly inside Google Ads.
- Tablet Adjustment: Since Tablets have $0$ conversions, start with a highly aggressive negative adjustment: $-80\%$ to $-100\%$.
- Mobile/Desktop Adjustment: While the ROAS is close (1.42 vs 1.33), Mobile has a much higher volume and cost. If you want to boost the ROAS further, you could try a small adjustment: $\mathbf{-5\%}$ to $\mathbf{-10\%}$ on Mobile, and/or $\mathbf{+5\%}$ on Desktop to test maximizing efficiency.
- Action: Log into Google Ads, navigate to the specific campaign, open the Device Report, and apply the calculated negative bid percentages to the Tablet device type (and any other underperforming devices).
👉 Read More: How to Diagnose Google Ads Campaign in Shopify
Targeting by Network Type & Time of Day
Once you’ve optimized at the device level using simplified reporting, dive deeper into Related Entities like Wi-Fi vs. Cellular and the conversion window.
4.1. Network Segmentation
Mobile conversion rates often drop on cellular networks because users are browsing on the go and may not complete a full checkout process. You can segment your Device Report data by Network Type in Google Ads.
4.2. Time of Conversion Analysis
Analyze the Time of Day report (under ‘Reports’ $\rightarrow$ ‘Time’). You may find that mobile clicks are high during the day but the actual conversions happen later in the evening on desktop. This confirms mobile’s role in the Consideration stage, but requires a more efficient bid, not an aggressive one.
Common Errors & Fixes: Debugging Inaccurate Data
| Common Error | Description & Fix |
| Data Lag/Mismatch | A slight delay between Google Ads and Shopify revenue data (especially crucial for real-time app reporting). Fix: Ensure you are comparing the same time periods and allow 24 hours for full data reconciliation. |
| “Bids Too Low” Warning | After implementing a negative bid adjustment, your Impression Share drops significantly. Fix: Your initial bid was likely already near the bottom. Implement a smaller negative adjustment (e.g., $-10\%$) or raise your base keyword bid to compensate, then apply the adjustment. |
| Ignoring Tablet Data | Merchants often overlook the small volume of Tablets. Fix: As shown in the AdTrack report, even low cost can lead to $0.00$ ROAS. Tablet traffic is highly distinct and often requires the most aggressive negative adjustment. |
A Real-World Bid Adjustment Scenario
Scenario: A Shopify merchant selling customized jewelry.
- Current State (Identified via AdTrack): Mobile CPA: $120. Desktop CPA: $40. Tablet ROAS: 0.15.
- Action Plan:
- Initial Bid Adjustment: Implement $-20\%$ on Mobile and a strong $-70\%$ on Tablet.
- Tracking: Monitor the results for one week.
- Result After 7 Days: Tablet spend is virtually eliminated. Mobile CPA drops to $85.
- Second Adjustment: Implement an additional $\mathbf{-10\%}$ on Mobile (totaling $-30\%$) to try and close the gap further.
- Long-Term Outcome: The blended campaign CPA decreased by $18\%$, leading to a significant ROAS increase and more budget for high-performing desktop/efficient mobile traffic.
Frequently Asked Questions
What is a good mobile conversion rate for a Shopify store?
A typical e-commerce mobile conversion rate ranges from $1.5\%$ to $2.5\%$, while desktop conversion rates are generally higher, ranging from $3.0\%$ to $4.5\%$. This difference is natural due to the complexity of the checkout process on a smaller screen. Your goal is not to match desktop rates, but to ensure your Cost Per Acquisition (CPA) on mobile is profitable.
How do I optimize shopify mobile conversion rate?
To optimize your shopify mobile conversion rate, focus on user experience (UX) and efficiency:
Speed: Achieve a Mobile PageSpeed Insights score above 70.
Checkout: Enable Shop Pay, PayPal, and other one-click payment options.
Analysis: Use tools like AdTrack to instantly identify which devices/segments need bid reduction to filter inefficient clicks.
Should I bid higher or lower on mobile?
You should bid lower on mobile if your Mobile CPA is higher than your target CPA or if it significantly underperforms your desktop CPA. Implementing a negative mobile bid adjustment allows you to acquire mobile users at a more efficient price, reserving higher bids for the desktop traffic that historically converts more reliably. Simplified reporting, like the one provided by AdTrack, makes this decision fast and data-driven.