E-commerce reports provide valuable insights into your sales and the purchasing behavior of your customers. Utilizing e-commerce reporting tools empowers you to make more informed decisions, enabling your business to flourish. By drilling deeper into customer preferences, product performance, sales targets, marketing tactics, and inventory control, you gain the knowledge required for strategic growth.
Navigating to the eCommerce Report
Within the Analyzely app, navigate to the “eCommerce Reports” section. This is where you’ll find comprehensive data related to your online sales.
eCommerce Reports Overview
Once you’ve accessed the eCommerce reports in Analyzely, you’ll encounter various metrics and dimensions that provide deep insights into your online store’s performance. Here’s an overview of the key metrics and dimensions available:
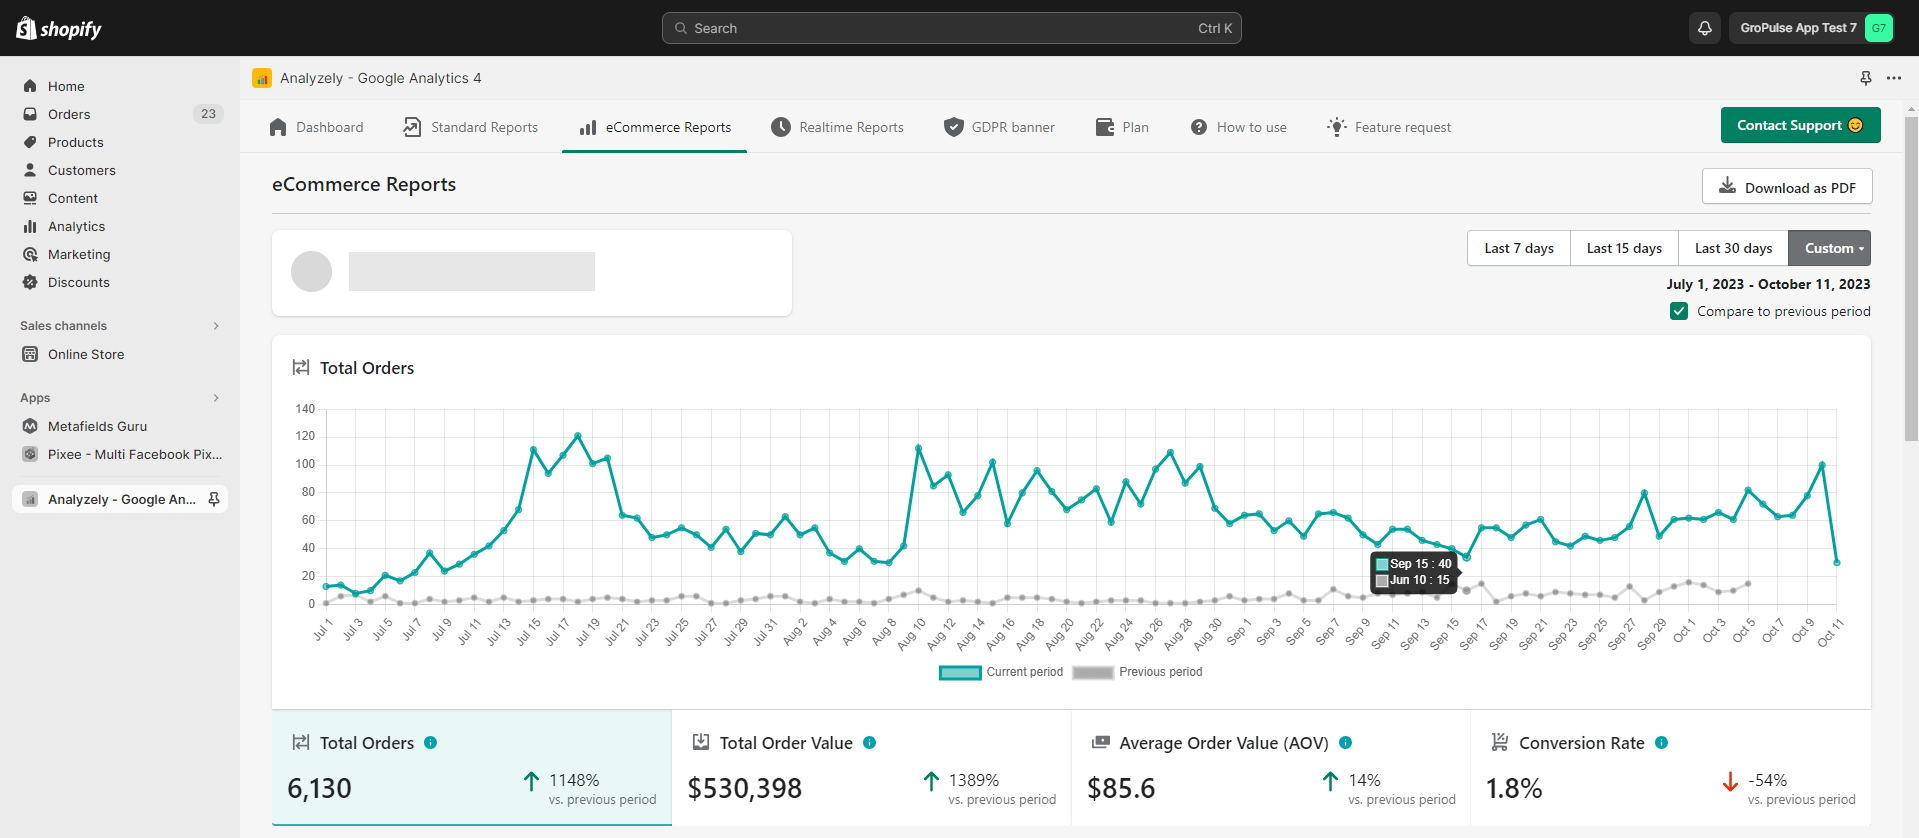
Total Orders
This report provides valuable insights into your store’s sales performance. It allows you to assess and comprehend your sales trends by comparing them to the previous period, helping you determine whether they are on the rise or declining.
Total Order Value
For any business, it’s crucial to know how much revenue is made from sales. With the Analyzely app, you can easily grasp this information through the Total Order Value report. This report allows you to track your business’s progress by comparing it to the previous period.

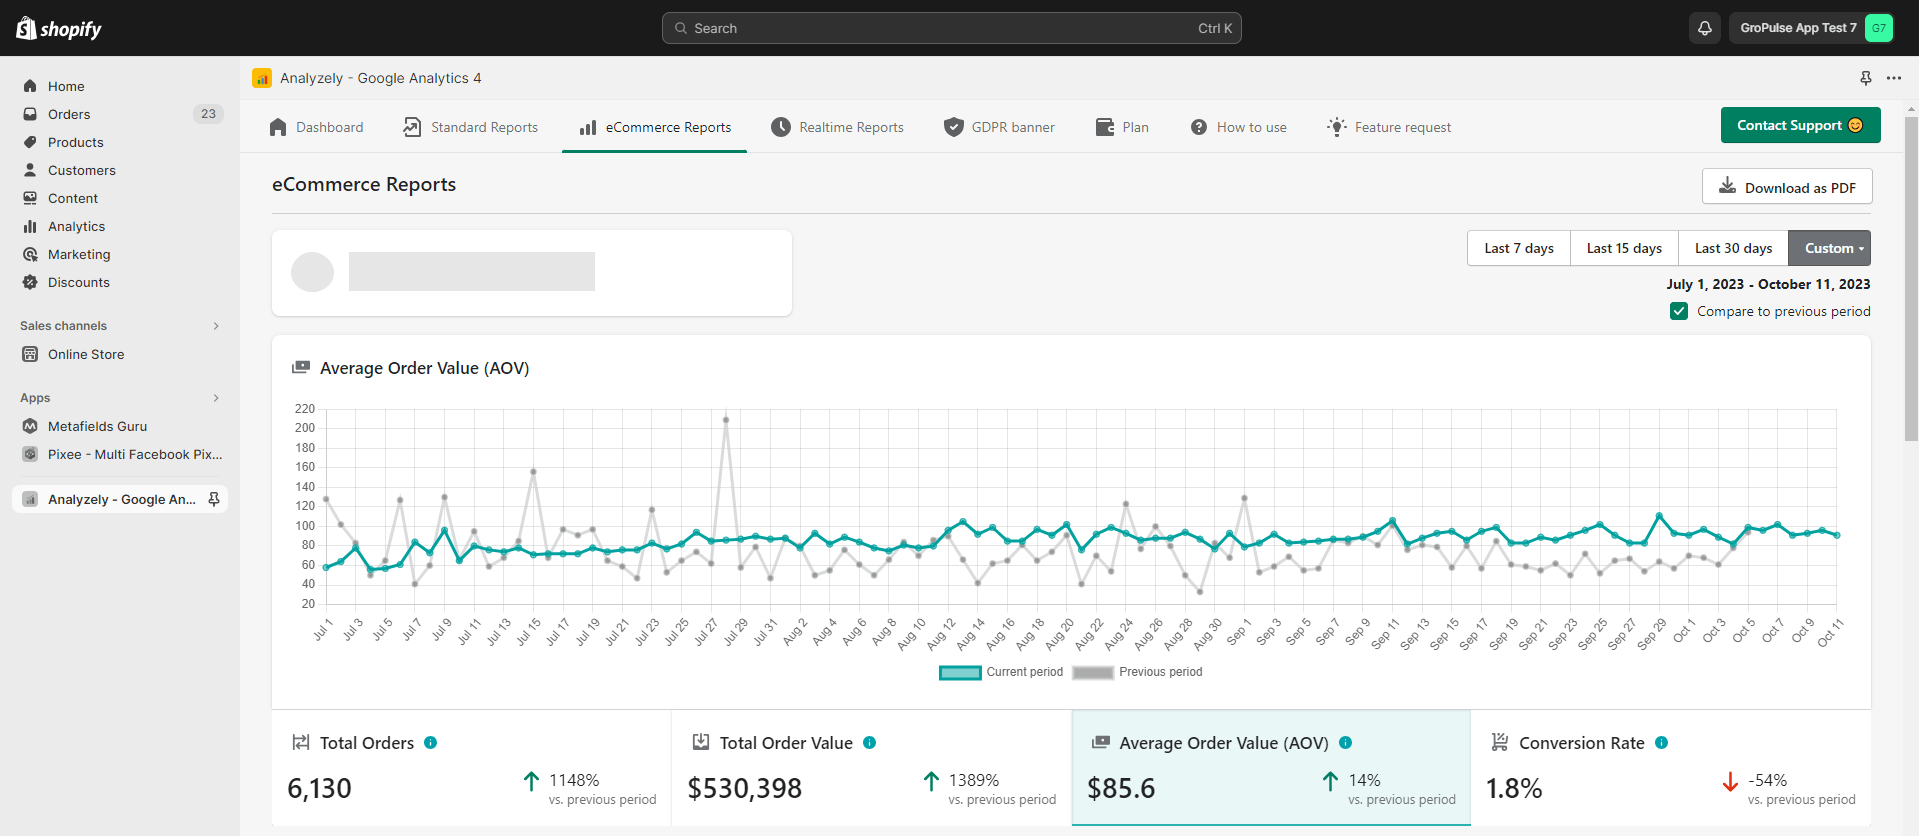
Average Order Value (AOV)
This report will help you understand how much revenue you could generate on average from each order or sale.
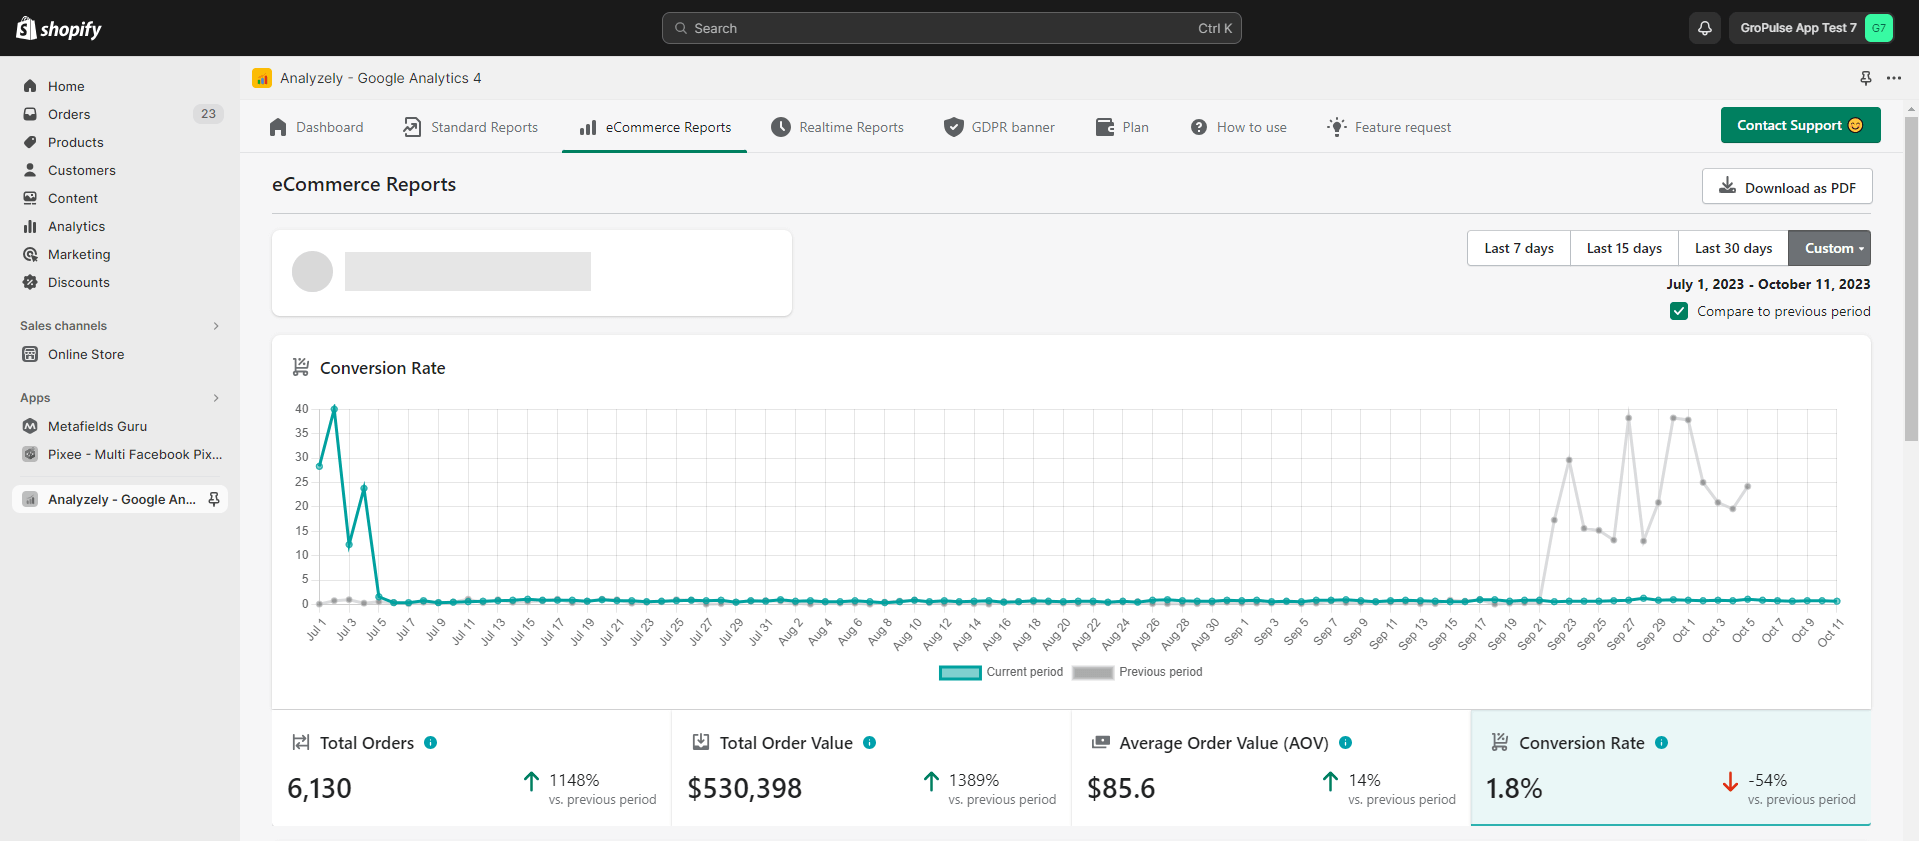
Conversion Rate
This report helps you understand the percentage of your store visitors who complete a purchase after visiting your store.
Conversion Funnel
If you’re interested in gaining insights into how your customers navigate through your eCommerce website and pinpointing where potential customers might be dropping off, you can leverage the power of the conversion funnel report in the Analyzely app. This report provides a visual representation of the path website visitors take, starting from simply viewing an item, then adding it to their cart, and ultimately completing a purchase.
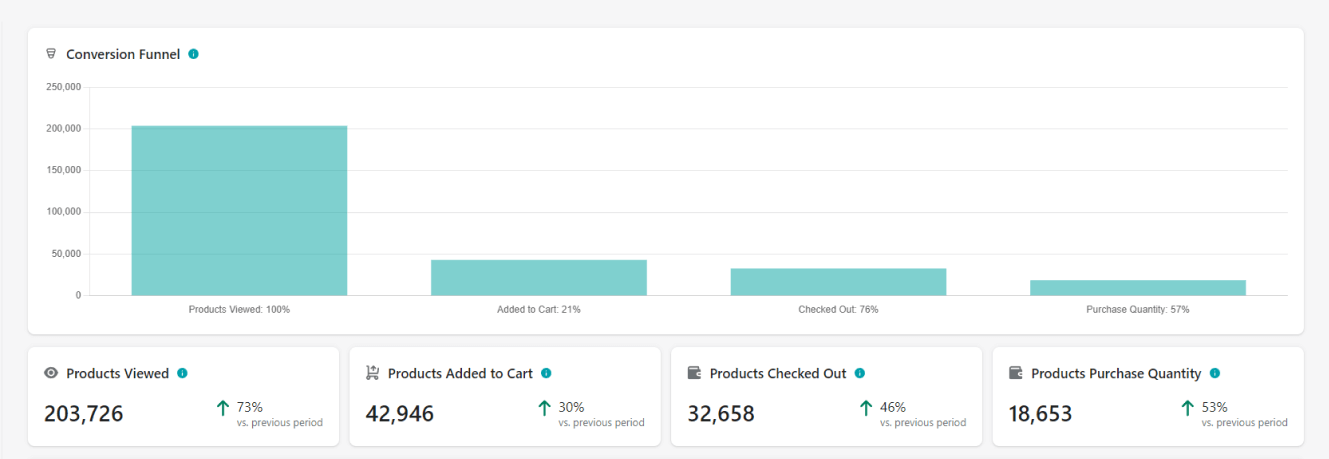
Conversion Funnel Metrics and Definitions:
- Products Viewed: The number of times products were viewed by visitors.
- Products Added to Cart: The number of times products were added to the shopping cart.
- Products Checked Out: The number of times users proceeded to checkout.
- Products Purchase Quantity: The quantity of products purchased.
Top Products
This report will help you understand the top-performing products in your store.

Top Products Metrics and Definitions:
- Product Name: Name of the top-performing products.
- Product Purchase Quantity: Quantity of a specific product purchased.
- Product Revenue: Revenue generated from a specific product.
- Product Views: Number of times a product page was viewed.
- Add to Cart: The quantity of which products are added to the cart.
- Cart to View Rate: The percentage of product views that resulted in a cart addition.
- Purchase-to-View Rate: The percentage of product views that led to a purchase.
Top Brands
This report makes it easy to discover which product brands are most popular among your customers and are generating revenue in your store.
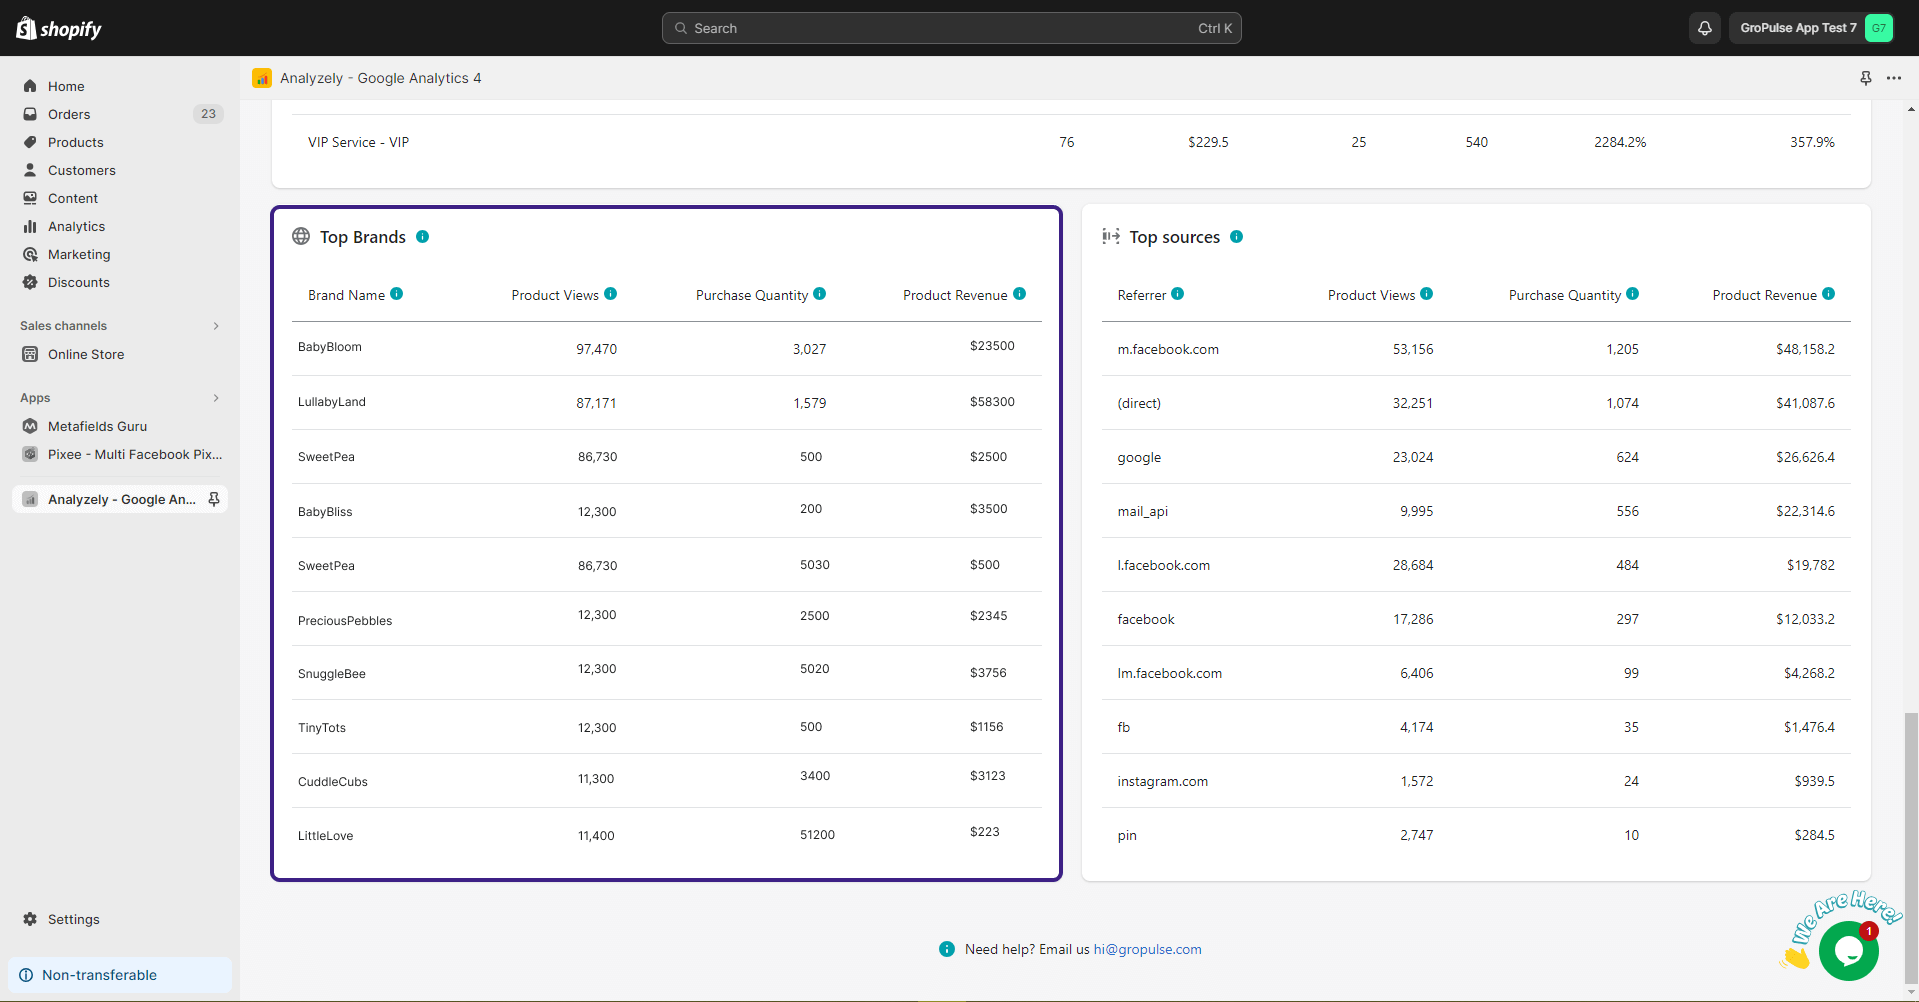
Top Brands Metrics and Definitions:
- Brand Name: Name of the top-performing brands.
- Product Views: Number of times products from a specific brand were viewed.
- Purchase Quantity: Quantity of products from a specific brand purchased.
- Product Revenue: Revenue generated from products of a specific brand
Top Sources
For online businesses, it’s crucial to know which channels or sources are bringing in the most revenue so you can create effective marketing strategies. With the Analyzely app, you can effortlessly gain insights and make informed decisions by checking out the top sources report.
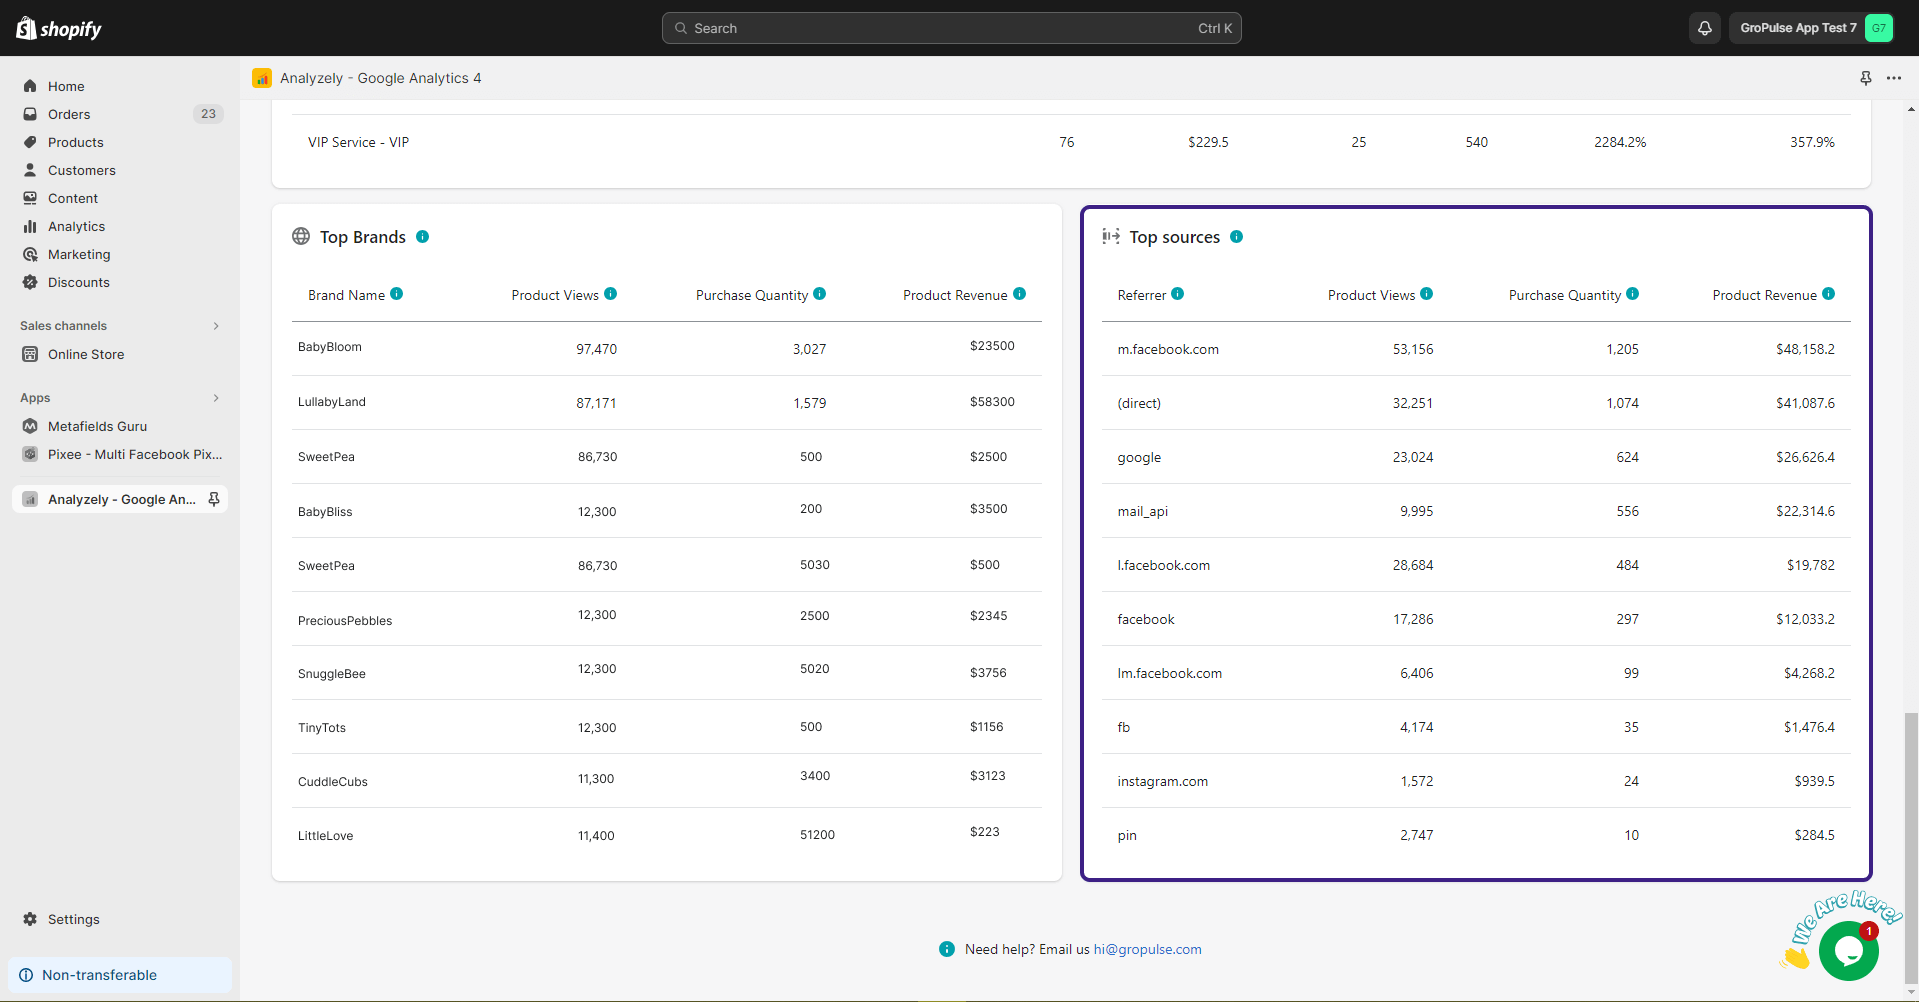
Top sources Metrics and Definitions:
- Referrer: The sources or channels through which users arrive at your online store.
- Product Views: The number of times a product was viewed from a specific referrer.
- Purchase Quantity: The quantity of products purchased from a specific referrer.
- Product Revenue: Revenue generated from products attributed to a specific referrer.
These metrics and dimensions provide a comprehensive view of your eCommerce performance, allowing you to make informed decisions to enhance your online store’s success.
Boost your business by installing the Analyzely app today.