Exploring Standard Reports and Data in the Analyzely App
This documentation will concentrate on exploring Google Analytics Acquisition reports and data, which provide insights into the origins of your website’s traffic.
The Analyzely app offers Standard Reports that enable you to gain a better understanding of your store users and traffic data.
Navigate to the Standard Report
To begin, access the Analyzely app, locate the Standard Report tab, and click on it.
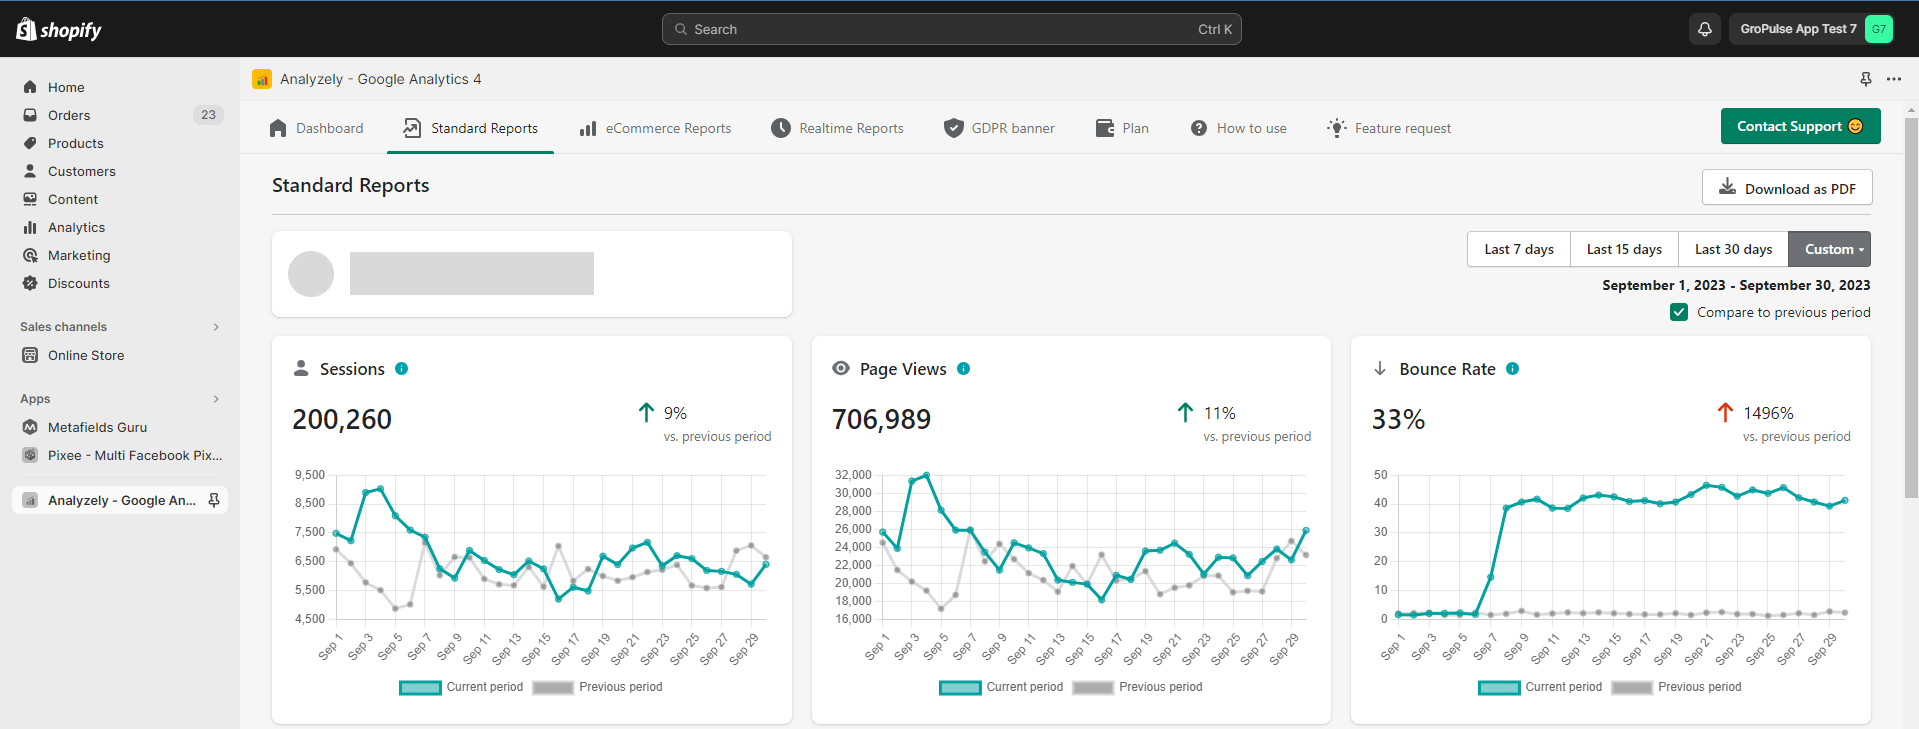
Standard Reports Overview
The Analyze App’s Standard Report offers various acquisition reports designed to help you analyze your store’s traffic sources:
- Sessions: A session on your website or app is a single, continuous user visit. It starts when a user lands on your site and ends if there’s no user interaction for a specified time, usually 30 minutes. A new session begins when the user returns and interacts with the site again. This section displays the number of sessions initiated on your website.
- Page Views: Page views represent the number of times users have viewed a specific page within your website. Here, you can observe the total number of pages visited by your site’s visitors.
- Bounce Rate: A “bounce” occurs when a user visits a single page on your site and then exits without interacting with that page or triggering any additional events or page views. In other words, they “bounce” away after viewing just one page. You can view the bounce rate percentage for your store here.
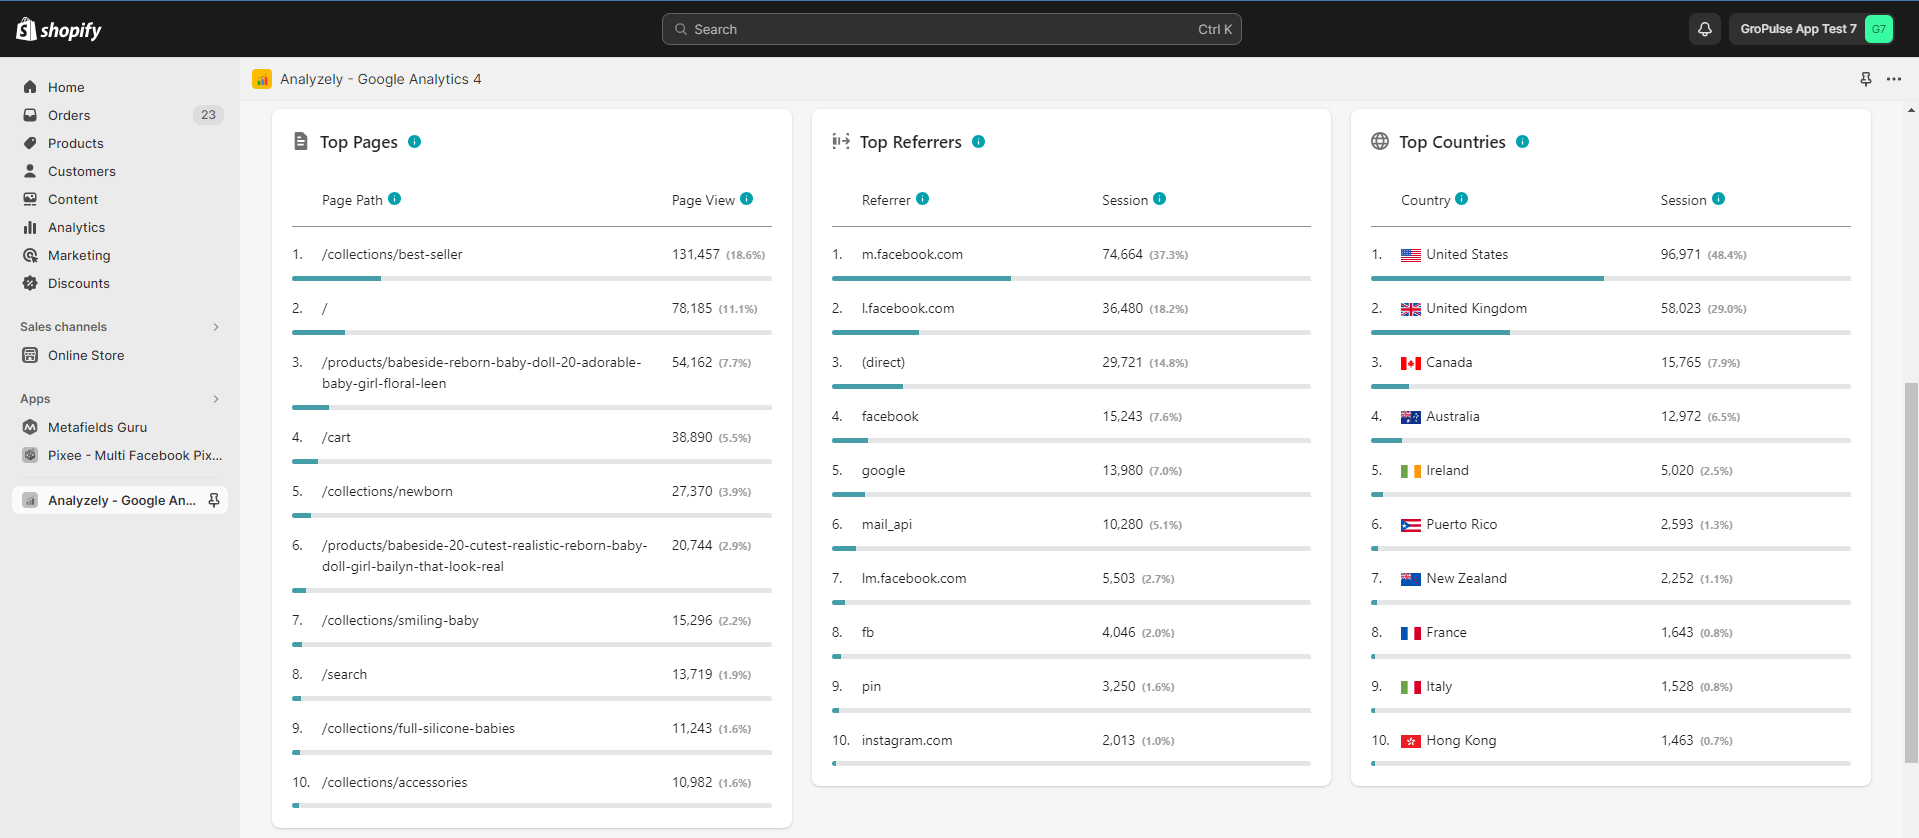
- Top Pages: This section identifies the most frequently visited pages on your website.
- Top Referrals: Analyzing top referrer data can provide valuable insights into the sources from which your users originate, enabling you to optimize your advertising campaigns more effectively.
- Top Countries: This report will help you understand the countries that most often visit your website.
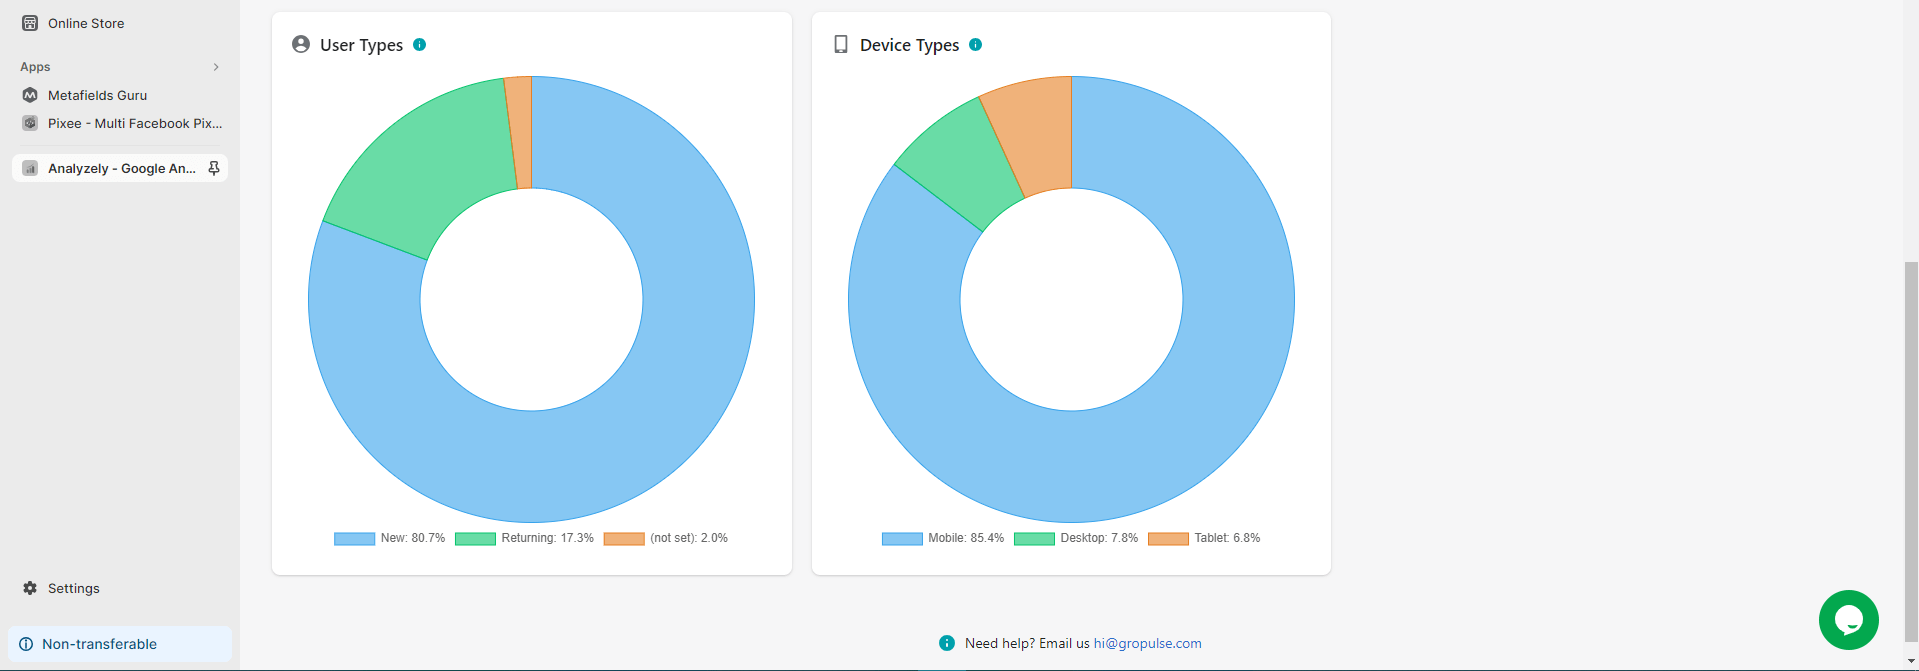
- User Types: It is essential to understand how much your customer is growing, whether they are returning or new customers. This section displays the percentage of users who are new to your website and those who are returning.
- Device Types: This report will help you understand the types of devices most often used to access your website. Here, you can see the percentage of users accessing your site via mobile or desktop devices.
Last updated on July 22, 2025
Was this article helpful?
Powered by Support Genix