The Dashboard is your central hub for managing all SalesPulse features and viewing quick performance insights.
Overview
When you open the SalesPulse app, you land on the Dashboard page. From here you can:
- View the activation status of all features
- Access quick stats for each feature
- Navigate to configure individual features
- Change the app language
- Get support
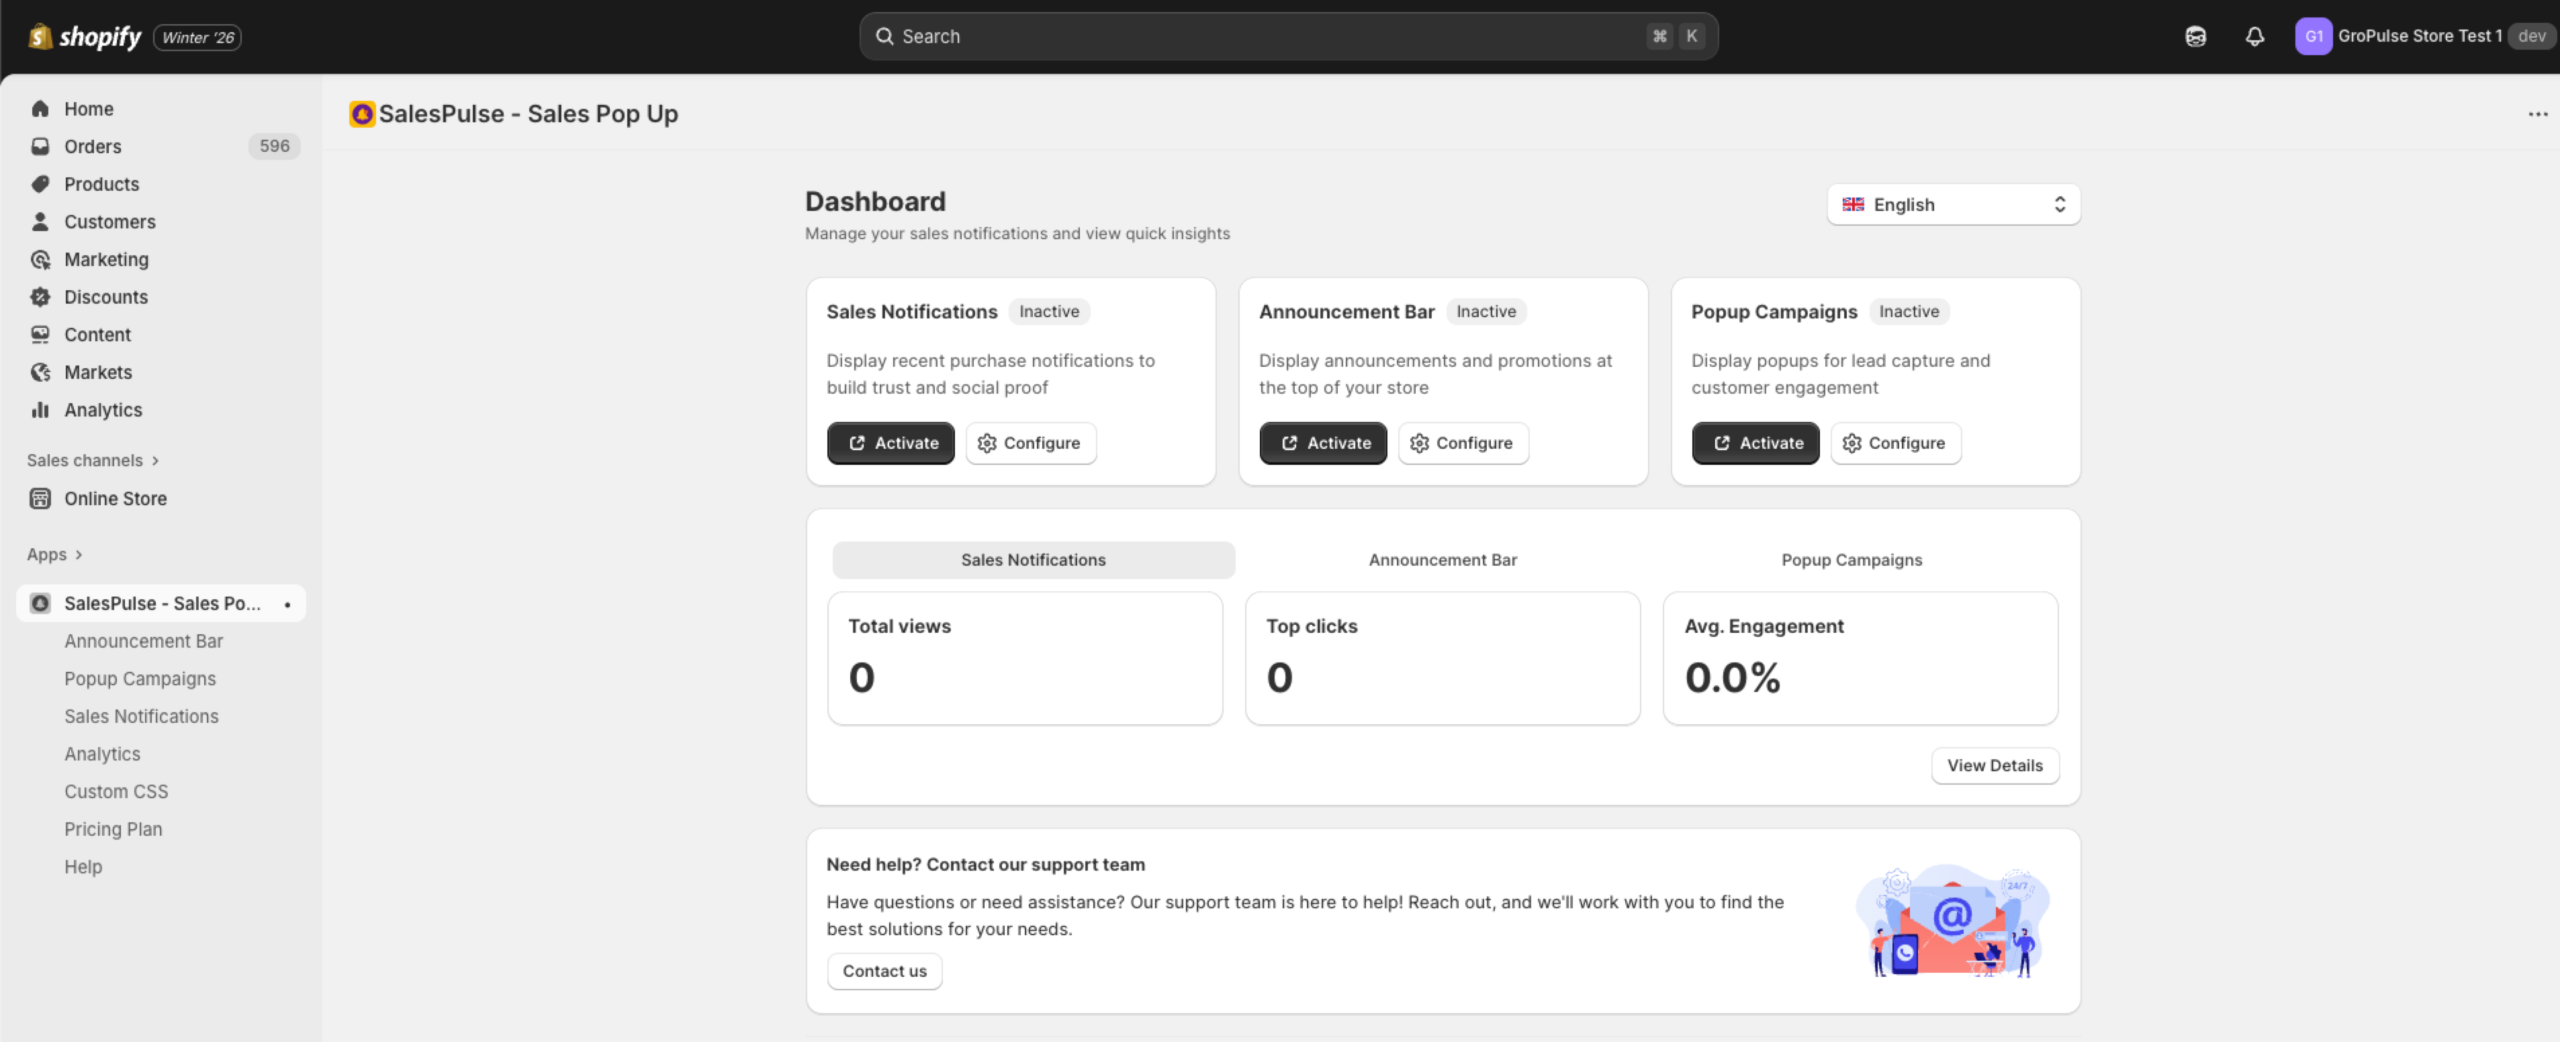
Feature Cards
The Dashboard displays three feature cards at the top:
Sales Notifications
| Element | Description |
|---|---|
| Status Badge | Shows “Active” (green) or “Inactive” (gray) |
| Description | Display recent purchase notifications to build trust and social proof |
| Activate/Deactivate | Opens Theme Customizer to toggle the feature |
| Configure | Opens the Sales Notifications settings page |
Announcement Bar
| Element | Description |
|---|---|
| Status Badge | Shows “Active” (green) or “Inactive” (gray) |
| Description | Display announcements and promotions at the top of your store |
| Activate | Opens Theme Customizer to enable the feature |
| Configure | Opens the Announcement Bar management page |
Popup Campaigns
| Element | Description |
|---|---|
| Status Badge | Shows “Active” (green) or “Inactive” (gray) |
| Description | Display popups for lead capture and customer engagement |
| Activate | Opens Theme Customizer to enable the feature |
| Configure | Opens the Popup Campaigns management page |
Quick Stats
Below the feature cards, you’ll find tabbed quick stats for each feature:
Sales Notifications Stats
- Total Views: Number of times notifications were displayed
- Top Clicks: Number of clicks on notification links
- Avg. Engagement: Percentage of views that resulted in clicks
Announcement Bar Stats
- Total Views: Number of times bars were displayed
- Top Clicks: Number of CTA button clicks
- Avg. Engagement: Click-through rate
Popup Campaigns Stats
- Total Views: Number of popup impressions
- Form Submissions: Number of completed form submissions
- Conversion Rate: Percentage of views that converted
Click View Details to navigate to the full Analytics page for detailed metrics.
Language Selector
In the top-right corner of the Dashboard, you can change the app language using the language dropdown. The app supports multiple languages including:
- English
- Spanish
- French
- German
- Portuguese (Brazil)
- Portuguese (Portugal)
- Italian
- Dutch
- Chinese (Simplified)
- Chinese (Traditional)
- Vietnamese
- Hindi
- Greek
- Finnish
- And more…
Navigation
The app sidebar (visible in Shopify Admin) provides quick access to all pages:
| Menu Item | Description |
|---|---|
| Announcement Bar | Manage announcement bars |
| Popup Campaigns | Manage popup campaigns |
| Sales Notifications | Configure sales notification settings |
| Analytics | View detailed analytics for all features |
| Custom CSS | Add custom styling |
| Pricing Plan | View and manage your subscription |
| Help | Access support and documentation |
Quick Actions
From the Dashboard, you can quickly:
- Check feature status – See at a glance which features are active
- Activate features – Click “Activate” to enable features in Theme Customizer
- Configure features – Click “Configure” to access settings
- View performance – Check quick stats without navigating away
- Get detailed analytics – Click “View Details” for comprehensive metrics
Last updated on February 17, 2026
Was this article helpful?
Powered by Support Genix