The Analytics Dashboard provides comprehensive performance metrics for all SalesPulse features, helping you understand how your notifications, announcement bars, and popup campaigns are performing.
Overview
Access the Analytics Dashboard from the sidebar navigation by clicking Analytics. The dashboard provides:
- Performance metrics for each feature
- Date range filtering
- Visual charts and graphs
- Detailed performance tables
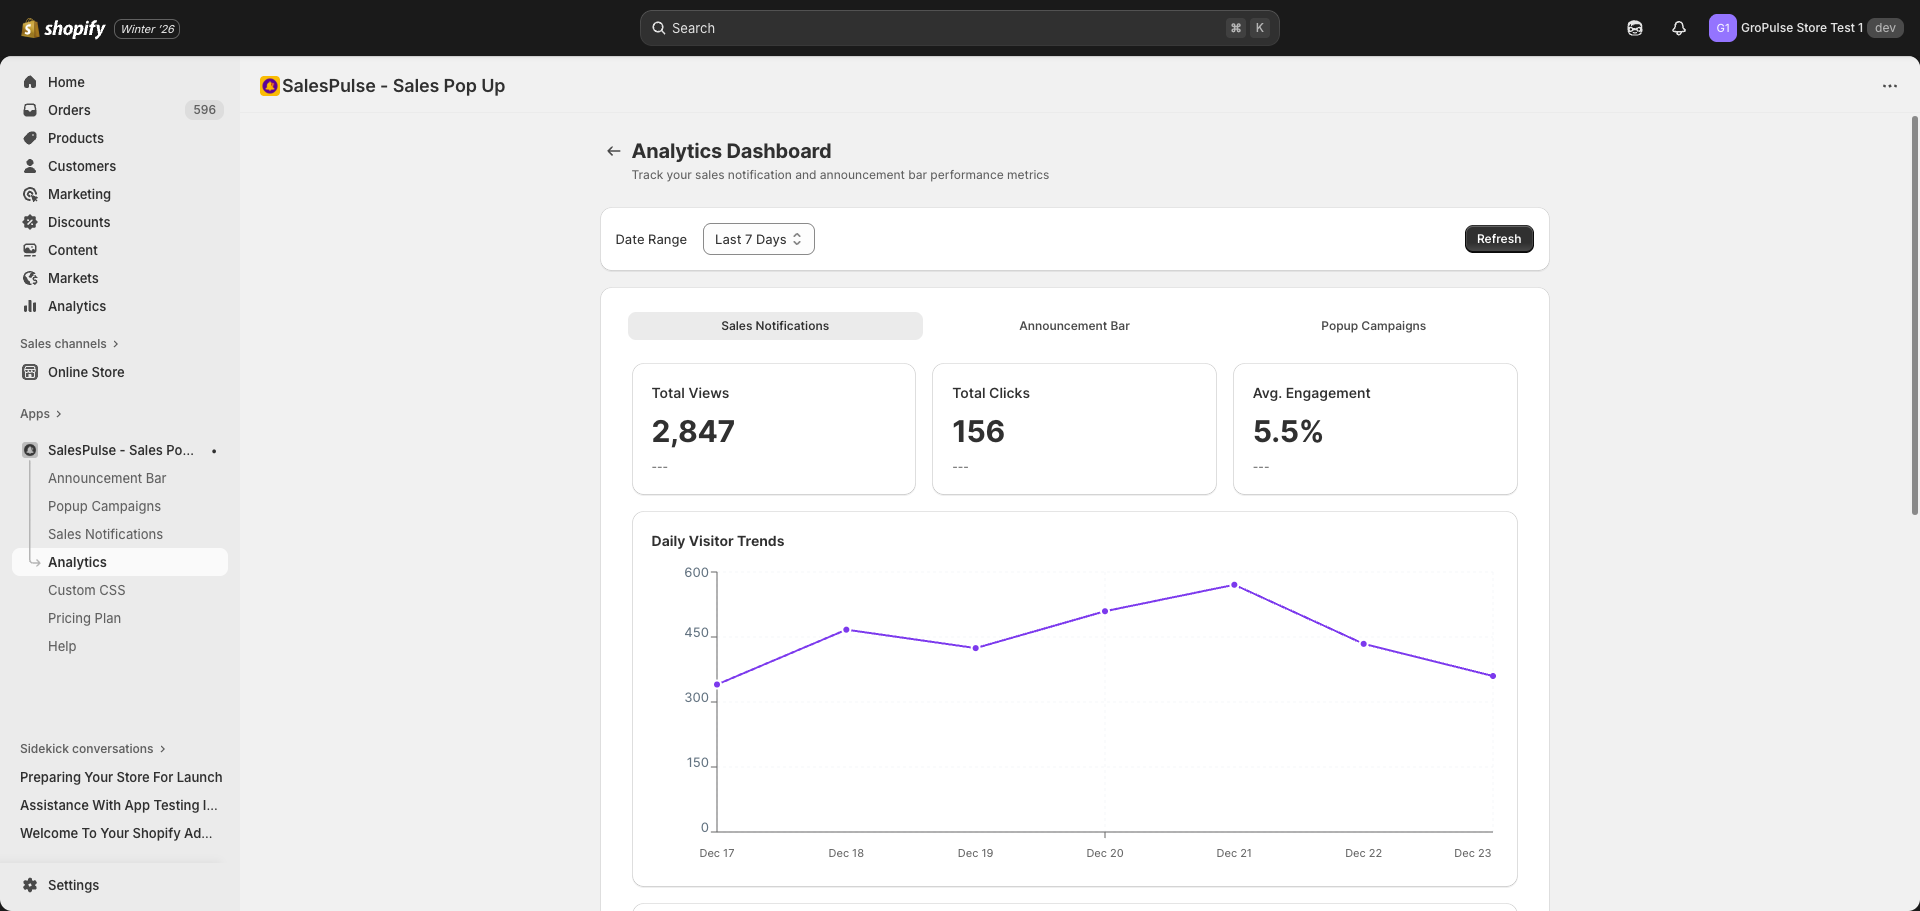
Date Range Filter
At the top of the dashboard, you can filter analytics data by time period.
Feature Tabs
The Analytics Dashboard has three tabs, one for each feature:
Sales Notifications Tab
Track how your sales notifications are performing:
Key Metrics:
- Total Views: Number of notification impressions
- Total Clicks: Number of clicks on notification product links
- Avg. Engagement: Click-through rate (clicks / views)
Charts:
- Daily Visitor Trends: Line chart showing daily notification views
- Device Breakdown: Pie chart showing desktop, mobile, and tablet usage
- Peak Activity Hours: Bar chart showing when visitors are most active
Performance Table: Shows detailed metrics for each day including:
- Date
- Impressions
- Click Rate
- Close Rate
- Avg Display Time
Announcement Bar Tab
Track how your announcement bars are performing:
Key Metrics:
- Total Views: Number of bar impressions across all bars
- Total Clicks: Number of CTA button clicks
- Avg. Engagement: Click-through rate
Charts:
- Daily Trends: Views and clicks over time
- Device Breakdown: Traffic by device type
- Peak Hours: Highest activity times
Performance Table: Individual bar performance with:
- Bar name
- Views
- Clicks
- CTR (Click-Through Rate)
Popup Campaigns Tab
Track how your popup campaigns are performing:
Key Metrics:
- Total Views: Number of popup impressions
- Form Submissions: Number of completed submissions
- Submission Rate: Submissions / views percentage
Charts:
- Daily Trends: Views and conversions over time
- Device Breakdown: Traffic by device type
- Peak Hours: Best performing times
Performance Table: Individual campaign performance with:
- Name
- Views
- Submissions
- Submission Rate