This guide explains how to track the performance of your announcement bars and use A/B testing to optimize results.
Analytics Dashboard
Each announcement bar has its own analytics dashboard to track performance.
Accessing Analytics
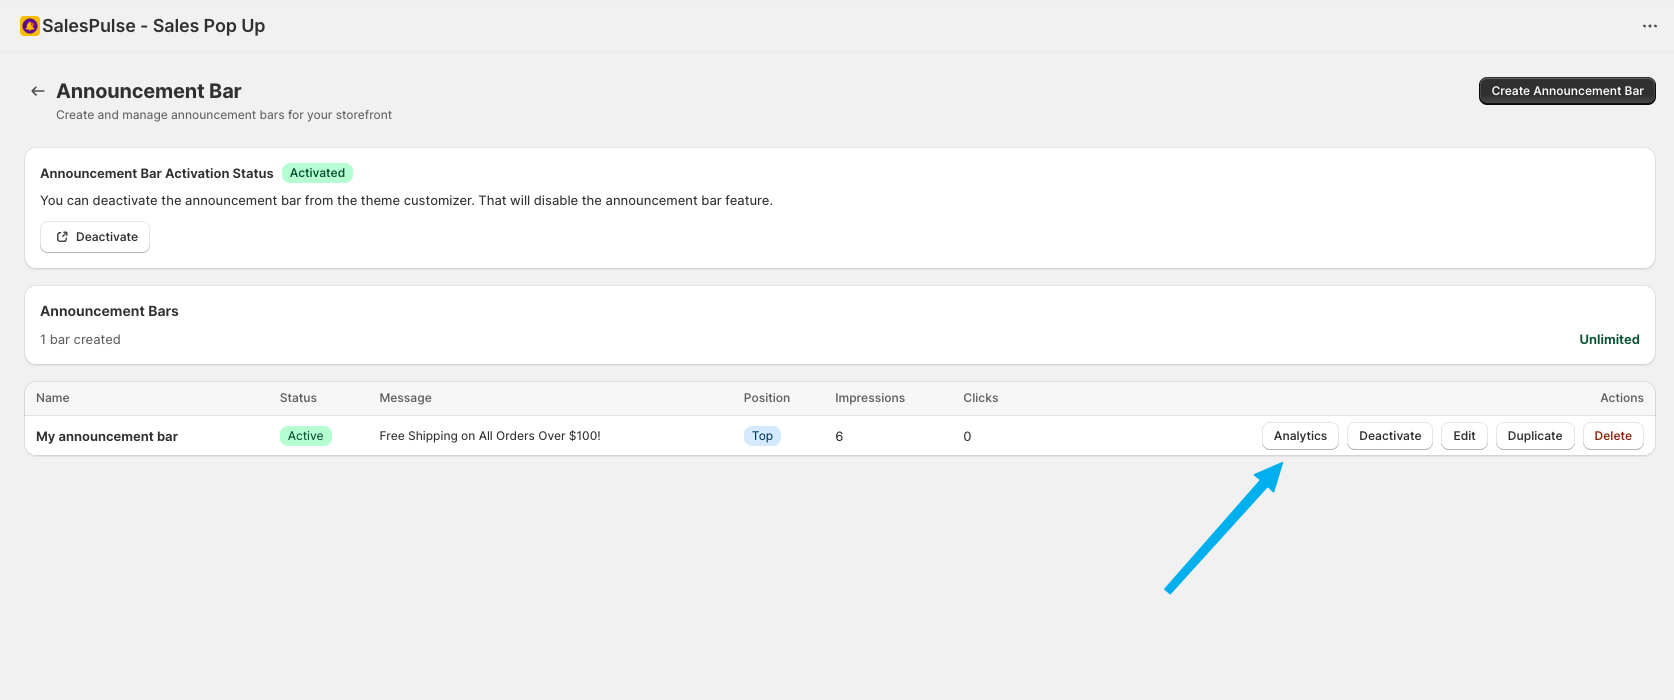
From the Bar List:
- Navigate to Announcement Bar from the sidebar
- Find the bar you want to analyze
- Click the Analytics button in the Actions column
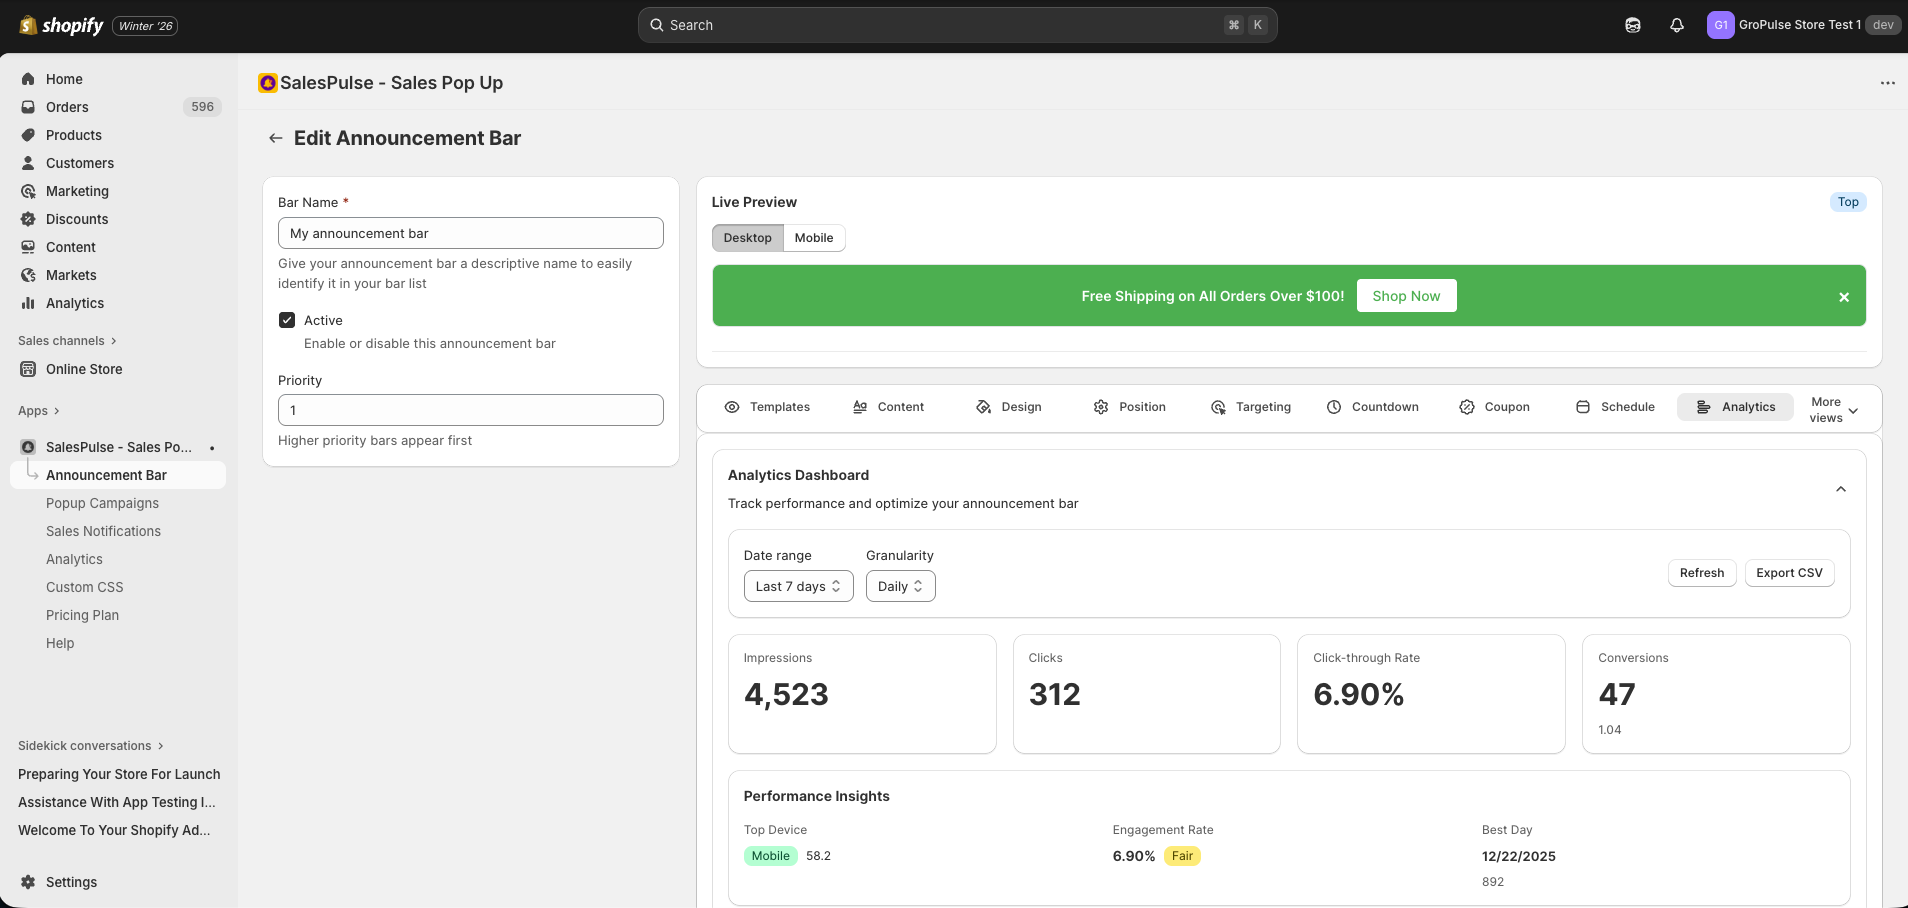
From the Editor:
- Open the Announcement Bar Editor for an existing bar
- Click More views to expand additional tabs
- Click Analytics Dashboard
Note: Analytics are available only after you save the announcement bar and it starts receiving traffic.
Key Metrics
Impressions
The number of times your announcement bar was displayed to visitors.
- Counted each time the bar loads on a page
- One visitor viewing multiple pages = multiple impressions
Clicks
The number of times visitors clicked on your CTA button.
Click-Through Rate (CTR)
The percentage of impressions that resulted in clicks:
CTR = (Clicks / Impressions) x 100%| CTR Range | Performance |
|---|---|
| Below 1% | Needs improvement |
| 1% – 3% | Average |
| 3% – 5% | Good |
| Above 5% | Excellent |
Conversions (Growth+ Plan)
The number of purchases made after clicking your bar:
- Tracked when a clicked visitor completes checkout
- Shows conversion rate (conversions / impressions)
Close Events
The number of times visitors closed your bar:
- Helps understand if bar is intrusive
- High close rates may indicate message issues
Analytics Filters
Date Range
Filter analytics by time period:
| Option | Description |
|---|---|
| Last 7 Days | Past week of data |
| Last 30 Days | Past month of data |
| Last 60 Days | Past two months (Growth+) |
| Last 90 Days | Past three months (Pro) |
Note: Data retention varies by plan level.
Granularity
Choose how data is grouped:
| Option | Description |
|---|---|
| Hourly | Hour-by-hour breakdown (Pro) |
| Daily | Day-by-day breakdown |
| Weekly | Week-by-week breakdown |
| Monthly | Month-by-month breakdown |
Performance Insights
The dashboard provides automatic insights:
Top Device
Shows which device type generates the most traffic:
- Desktop, Mobile, or Tablet
- Percentage of total traffic
Engagement Rate
Overall engagement with your bar:
- Rated as “Good” (>3%) or “Fair” (<3%)
- Based on CTR calculation
Best Performing Day
Identifies your highest-traffic day:
- Date with most impressions
- Useful for scheduling future campaigns
Device Breakdown
See how your bar performs across different devices:
| Metric | Description |
|---|---|
| Device | Desktop, Mobile, or Tablet |
| Impressions | Views on that device |
| Clicks | Clicks from that device |
| Percentage | Share of total traffic |
| CTR | Click-through rate per device |
Use this data to:
- Identify if mobile needs different messaging
- Optimize for your primary device audience
- Adjust targeting if performance varies significantly
Page Type Breakdown (Growth+)
See performance by page type:
| Page Type | Metrics |
|---|---|
| Home | Impressions, Clicks, CTR |
| Collection | Impressions, Clicks, CTR |
| Product | Impressions, Clicks, CTR |
| Cart | Impressions, Clicks, CTR |
| Other | Impressions, Clicks, CTR |
Use this data to:
- Identify high-performing page types
- Adjust targeting based on page performance
- Create page-specific bars
Geographic Breakdown (Pro)
See performance by country:
| Metric | Description |
|---|---|
| Rank | Country ranking by traffic |
| Country | Country name |
| Impressions | Views from that country |
| Clicks | Clicks from that country |
| CTR | Click-through rate per country |
| Percentage | Share of total traffic |
Use this data to:
- Identify top markets
- Create country-specific campaigns
- Adjust geo-targeting
Top Performing Days
See your best-performing days:
- Ranked by impressions
- Shows date, impressions, clicks, and CTR
- Helps identify traffic patterns
Exporting Data
Export your analytics data to CSV (Pro plan):
- Click Export CSV button
- File downloads with all available data
- Includes all metrics and breakdowns
A/B Testing
Test different bar variants to find what works best. This is a Pro plan feature.
Accessing A/B Testing
- Open the Announcement Bar Editor
- Click More views to expand additional tabs
- Click A/B Testing Settings
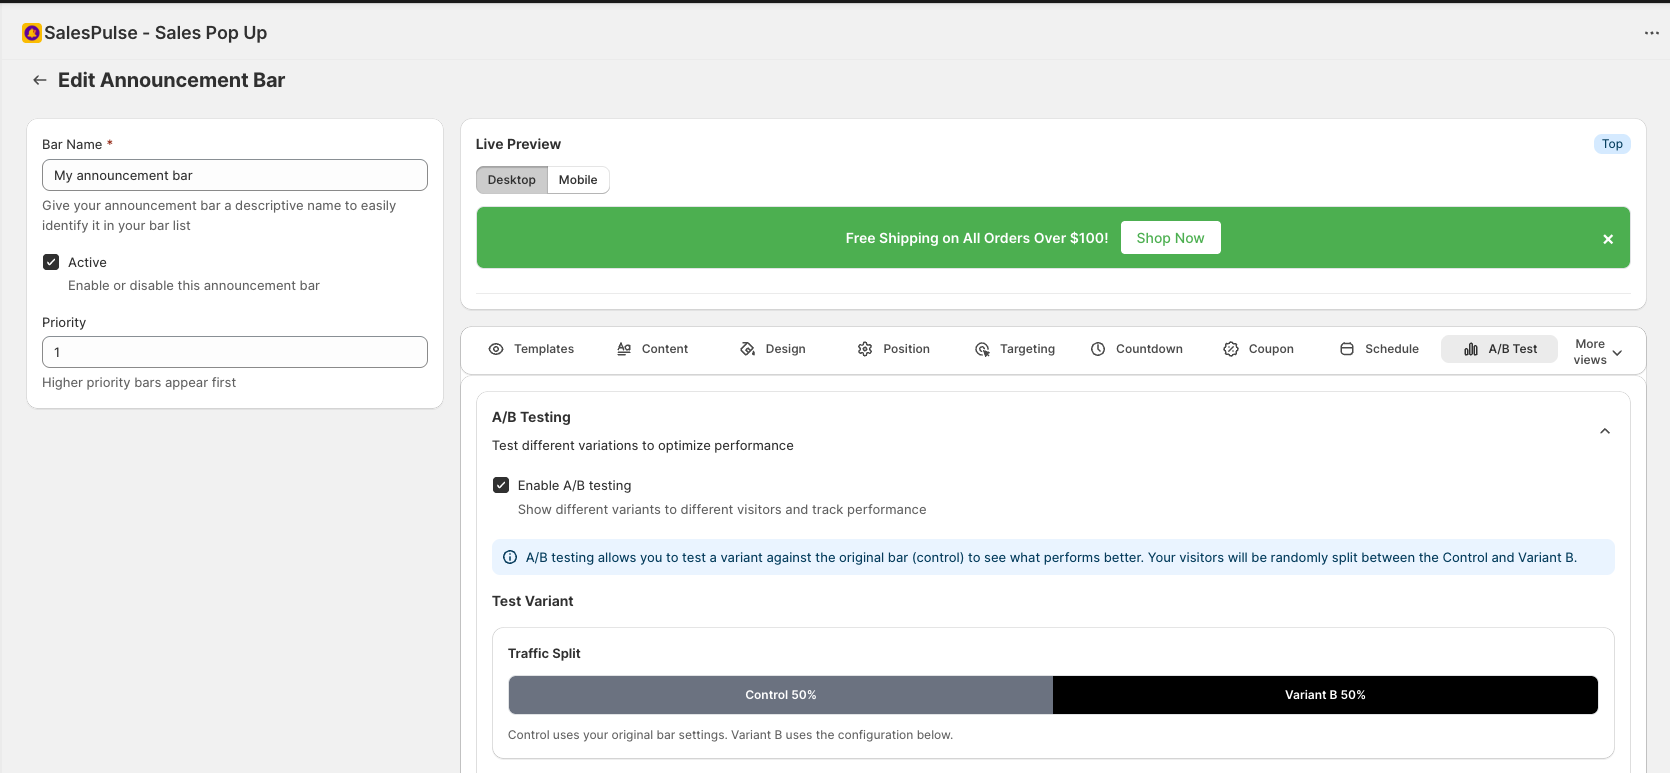
How A/B Testing Works
- Control (Variant A): Your original bar settings
- Variant B: A modified version you create
- Traffic Split: Visitors are randomly assigned to see one variant
- Consistent Experience: Each visitor always sees the same variant
- Performance Tracking: Compare metrics between variants
Setting Up an A/B Test
- Check Enable A/B testing
- Click Create Variant B
- Configure Variant B settings:
- Message text
- Background color
- Text color
- CTA button text
- CTA button colors
- Set the traffic split (percentage of visitors who see Variant B)
- Save and let the test run
Traffic Split
Use the slider to control the split:
| Split | Description |
|---|---|
| 50/50 | Equal traffic to each variant |
| 70/30 | More traffic to Control |
| 30/70 | More traffic to Variant B |
Recommendation: Start with 50/50 for fastest results, then adjust based on early data.
What to Test
Test one element at a time for clear results:
| Element | Test Ideas |
|---|---|
| Message | Different value propositions |
| CTA Text | “Shop Now” vs “Get 20% Off” |
| Colors | Brand colors vs contrast colors |
| Offer | 20% off vs free shipping |
Reading A/B Test Results
The dashboard shows side-by-side comparison:
| Metric | Variant A | Variant B |
|---|---|---|
| Impressions | Count | Count |
| Clicks | Count | Count |
| CTR | Percentage | Percentage |
| Conversions | Count | Count |
Winner Indicator
The dashboard automatically identifies the winner:
- Shows which variant has higher CTR
- Displays the difference in percentage points
When to End a Test
Run tests until you have:
- Statistical significance: Enough data to be confident
- Minimum impressions: At least 1,000 per variant
- Consistent results: Winner remains consistent over time
Recommended test duration: 1-2 weeks minimum
Applying Test Results
After identifying a winner:
- Note the winning configuration
- Disable A/B testing
- Update your bar with winning settings
- Or create a new test with a new Variant B
Analytics Best Practices
Regular Monitoring
- Check analytics weekly
- Look for trends over time
- Compare performance across bars
Data-Driven Decisions
- Use metrics to guide changes
- Don’t rely on assumptions
- Test before making major changes
Seasonal Considerations
- Compare similar time periods
- Account for holidays and events
- Track year-over-year performance
Actionable Insights
If CTR is low:
- Test different messages
- Try more compelling CTAs
- Check targeting settings
If close rate is high:
- Make the bar less intrusive
- Improve message relevance
- Consider different targeting
Plan-Based Features
| Feature | Free | Growth | Pro |
|---|---|---|---|
| Basic Analytics | Yes | Yes | Yes |
| Date Range | 30 days | 60 days | 90 days |
| Hourly Granularity | No | No | Yes |
| Conversion Tracking | No | Yes | Yes |
| Page Type Breakdown | No | Yes | Yes |
| Geographic Breakdown | No | No | Yes |
| CSV Export | No | No | Yes |
| A/B Testing | No | No | Yes |
Troubleshooting
No Analytics Data
- Confirm the bar has been saved
- Check that the bar is active
- Verify the feature is activated in theme
- Wait for traffic to accumulate
Metrics Not Updating
- Data may take a few minutes to process
- Click the Refresh button
- Check your date range selection
A/B Test Not Running
- Confirm you have the Pro plan
- Check that A/B testing is enabled
- Verify Variant B is configured
- Ensure the bar is active
Conversions Not Tracking
- Confirm you have Growth plan or higher
- Verify the click is followed by a purchase
- Check that checkout completes successfully