This guide explains how to track the performance of your popup campaigns using the dedicated analytics dashboard.
Accessing Campaign Analytics
From the Campaign List
- Navigate to Popup Campaigns from the sidebar
- Find the campaign you want to analyze
- Click the Analytics button in the Actions column
Note: Analytics are available only after you save the campaign and it starts receiving traffic.
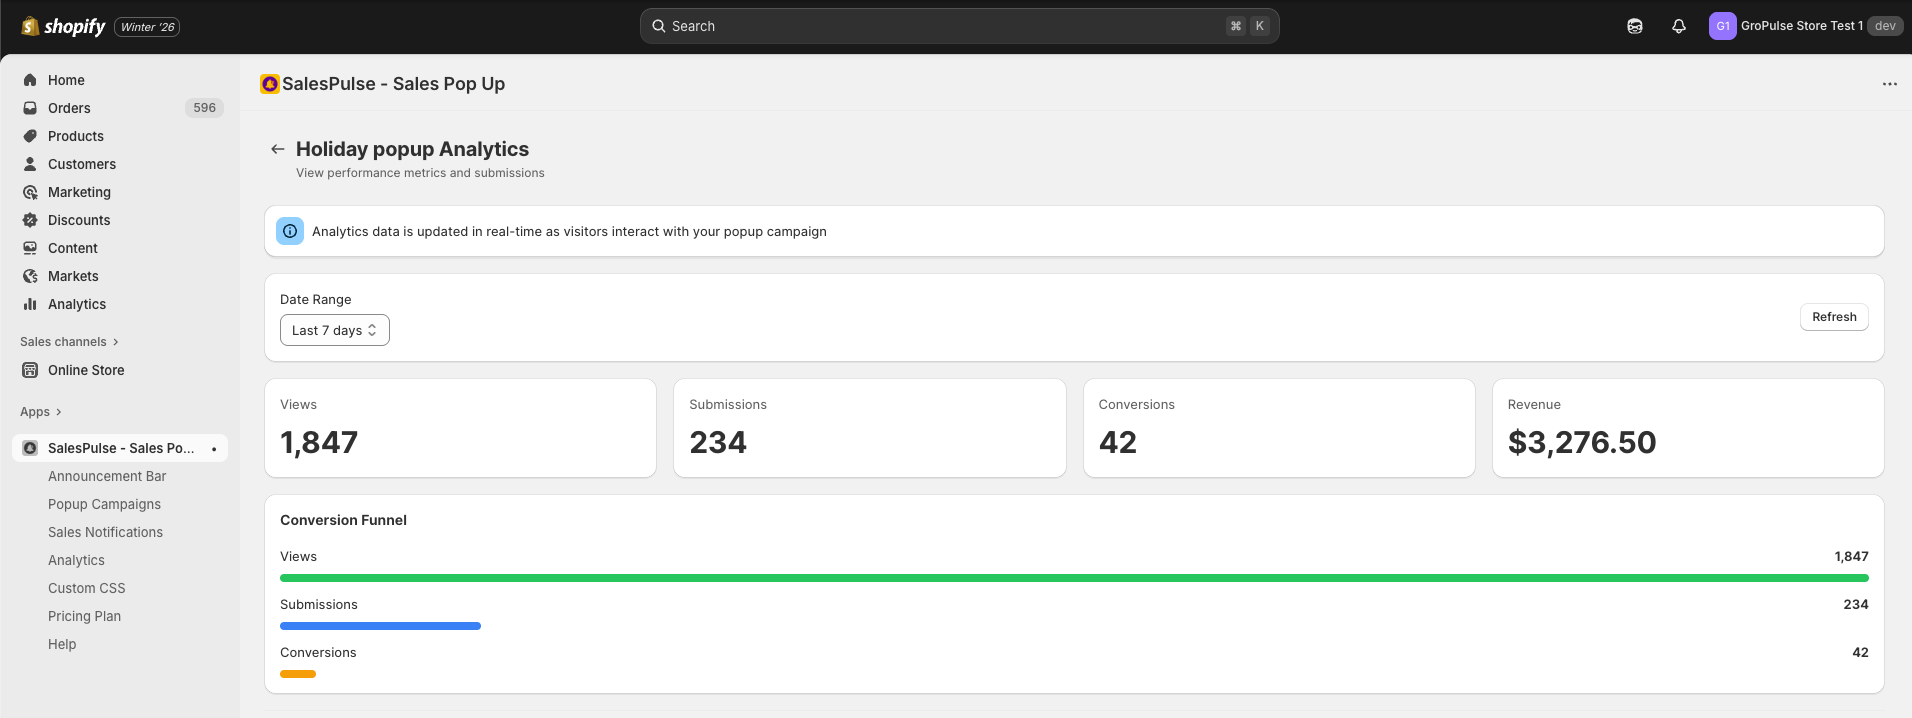
Analytics Dashboard Overview
Date Range Filter
Filter your analytics data by time period using the dropdown:
| Option | Description |
|---|---|
| Last 7 Days | Past week of data |
| Last 30 Days | Past month of data |
| Last 60 Days | Past two months |
| Last 90 Days | Past three months |
Click the Refresh button to update the data with the latest metrics.
Key Metrics
The dashboard displays four key metric cards:
Views
The number of times your popup was fully displayed to visitors.
- Counted each time the popup loads completely on a page
- One visitor viewing multiple pages may count as multiple views
- Filtered by your frequency and targeting settings
Submissions
The number of form submissions received.
- Only counts successful submissions
- Shows the submission rate as a percentage (submissions / views)
- Includes submissions to integrated platforms (Shopify, Klaviyo, Mailchimp)
Conversions
The number of purchases made after a visitor submitted the form.
- Tracked when a submitted visitor completes checkout
- Shows the conversion rate as a percentage (conversions / views)
- Helps measure the revenue impact of your popup
Revenue
The total revenue generated from conversions.
- Sum of all order values from converted visitors
- Shows the average revenue per conversion
- Helps calculate the ROI of your popup campaign
Conversion Funnel
The conversion funnel provides a visual representation of your popup’s performance through three stages:
| Stage | Description |
|---|---|
| Views | Total number of popup views (full-width bar) |
| Submissions | Number of form submissions with percentage rate |
| Conversions | Number of purchases with percentage rate |
Each stage shows:
- The count value
- A proportional progress bar
- The percentage rate (for Submissions and Conversions)
The funnel helps you identify where visitors drop off:
- Low submissions: Improve your offer, copy, or form design
- Low conversions: Review your follow-up emails or checkout experience
Performance by Page Type
This table shows how your popup performs on different page types:
| Column | Description |
|---|---|
| Page Type | The type of page (Home, Product, Collection, Cart) |
| Views | Number of popup views on that page type |
| % of Traffic | Percentage of total traffic from that page type |
Use this data to:
- Identify which pages generate the most popup views
- Understand your traffic distribution across page types
- Adjust targeting to focus on high-traffic pages
Recent Submissions
View the most recent form submissions with details:
| Column | Description |
|---|---|
| Date | Date of the submission |
| Submitted email address | |
| Country | Country where the visitor submitted from |
| Device | Device type (Desktop, Mobile, or Tablet) |
| Converted | Whether the visitor made a purchase (Yes/No) |
Export CSV
Click the Export CSV button to download all submission data for further analysis. The export includes:
- Full email addresses
- Submission dates and timestamps
- Country and device information
- Conversion status
A/B Testing
Test different content variations to optimize popup performance. A/B testing is available on the Pro plan.
Accessing A/B Testing
- Open the Popup Campaign Editor for an existing campaign
- Click the A/B Testing tab
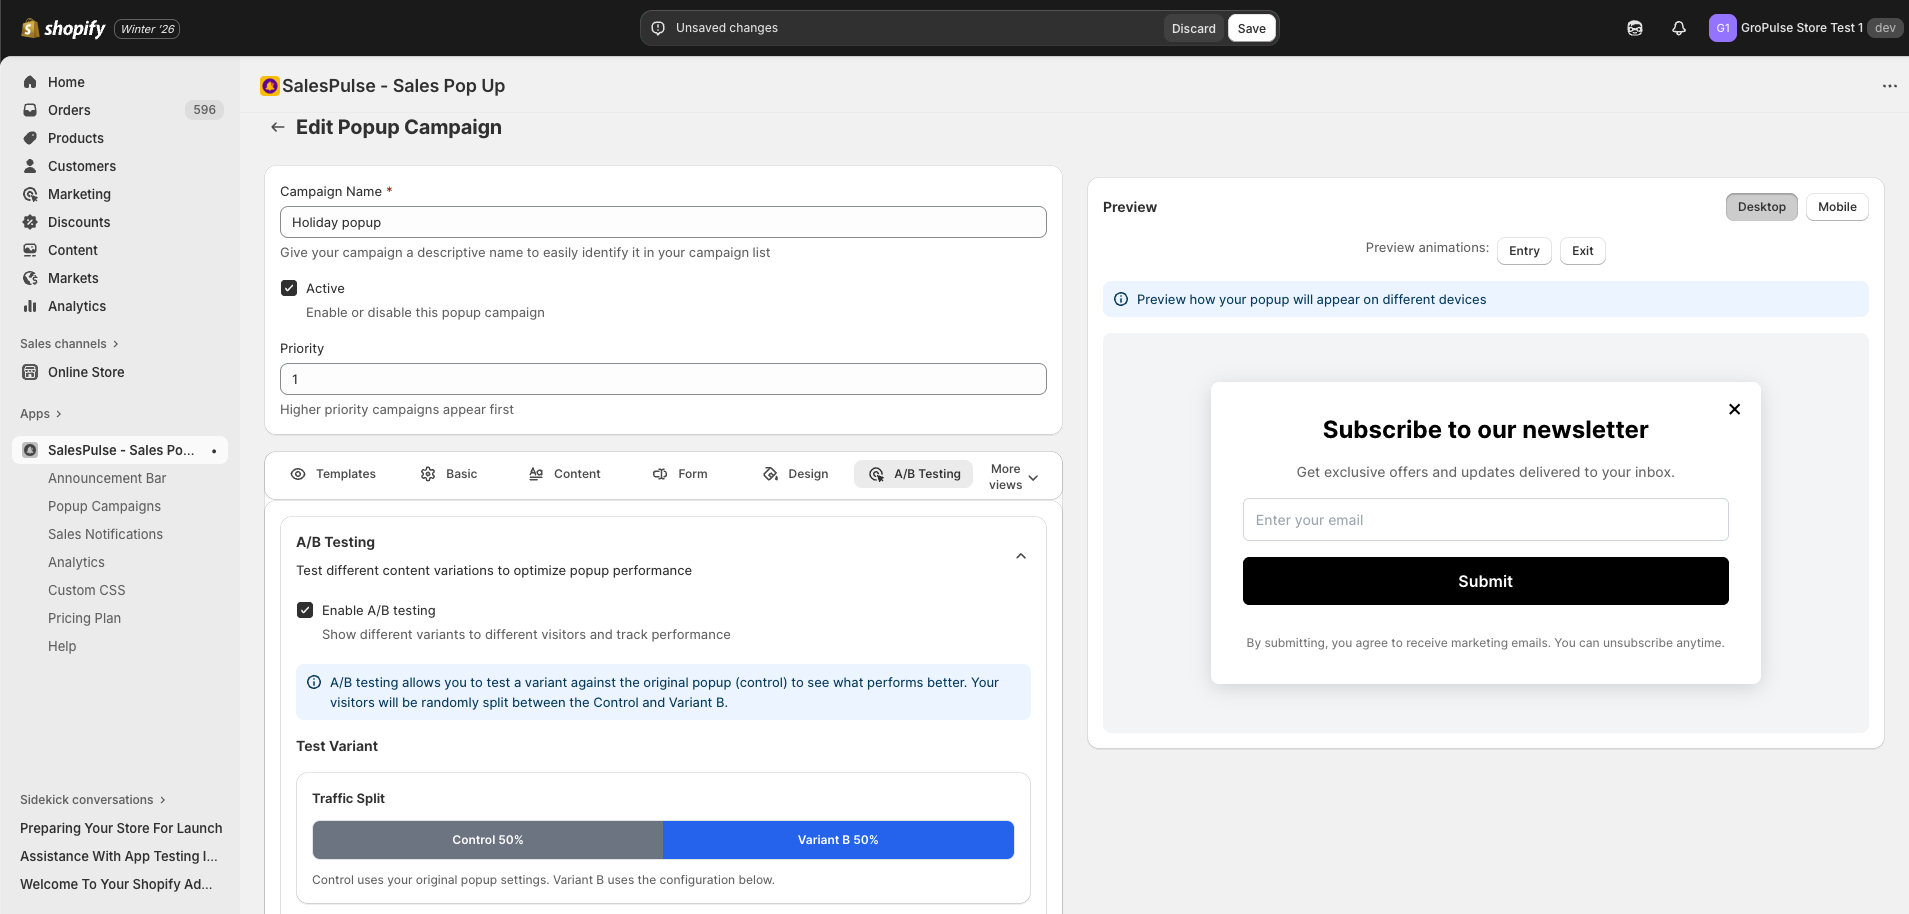
Enabling A/B Testing
- Check Enable A/B testing
- This shows different variants to different visitors and tracks performance
Note: A/B testing allows you to test a variant against the original popup (control) to see what performs better. Your visitors will be randomly split between the Control and Variant B.
Traffic Split
The Traffic Split section shows how visitors are divided between variants:
- Control: Percentage of visitors who see your original popup (default 50%)
- Variant B: Percentage of visitors who see the test variant (default 50%)
Use the Variant B Traffic Split slider to adjust the percentage (0-100%). The remaining percentage will see Control.
Variant B Configuration
Configure what’s different in Variant B:
| Field | Description |
|---|---|
| Headline | Enter variant headline (leave empty to use Control’s headline) |
| Description | Enter variant description (leave empty to use Control’s description) |
| Button Text | Enter variant button text (leave empty to use Control’s button text) |
Note: Button text applies to submit button (if popup has form fields) or CTA button (if no form fields).
Tip: Leave fields empty to use the Control’s content. Only fill in the fields you want to test.
Click Remove Variant to delete Variant B and disable A/B testing.
Performance Comparison
The Performance Comparison section shows side-by-side metrics for both variants:
Control (Variant A):
- Views
- Submissions
- Submission Rate (%)
- Conversions
- CVR (Conversion Rate %)
Variant B:
- Views
- Submissions
- Submission Rate (%)
- Conversions
- CVR (Conversion Rate %)
Compare these metrics to determine which variant performs better.
How A/B Testing Works
- Each visitor is randomly assigned to either Control or Variant B
- Control (Variant A) shows your original popup configuration
- Variant B shows the test configuration you define
- The assignment is stored so visitors always see the same variant
- Track views, submissions, and conversions to compare performance
A/B Testing Best Practices
- Test one element at a time for clear results
- Run tests long enough: At least 1,000 views per variant
- Minimum duration: 1-2 weeks
- Apply results: Update your campaign with winning settings
Analyzing Your Performance
Low Submission Rate
If your submission rate is below 2%, consider:
- Improve the offer: Make it more compelling
- Simplify the form: Reduce required fields to just email
- Better targeting: Show to more relevant visitors
- Adjust timing: Try different trigger delays
- Improve copy: Test different headlines and CTAs
Performance by Page Insights
| Page Type | Typical Performance |
|---|---|
| Home | Moderate – visitors are browsing |
| Product | High – visitors show purchase intent |
| Collection | Good – visitors are exploring |
| Cart | Varies – may be intrusive at checkout |
Troubleshooting
No Analytics Data
- Confirm the campaign has been saved
- Check that the campaign is active (not paused)
- Verify the popup feature is activated in your theme
- Wait for traffic to accumulate
- Check your date range selection
Metrics Not Updating
- Data may take a few minutes to process
- Click the Refresh button
- Check your date range selection
- Clear your browser cache and reload
Submissions Not Showing
- Verify form submissions are working
- Check integration status (Klaviyo, Mailchimp)
- Ensure popup is triggering correctly on the storefront
- Test the popup yourself to confirm functionality
A/B Test Not Running
- Confirm you have the Pro plan
- Check that A/B testing is enabled
- Verify Variant B is configured
- Ensure the campaign is active
Best Practices
Regular Monitoring
- Check analytics at least weekly
- Look for trends over time
- Compare performance across campaigns
Data-Driven Optimization
- Use metrics to guide changes
- Don’t rely on assumptions
- Make one change at a time to measure impact