This guide explains how to use AdTrack’s Ad Report feature to view and analyze your Google Ads performance data.
Overview
The Ad Report provides comprehensive insights into your Google Ads performance with:
- Key performance metrics at a glance
- Campaign-level performance breakdown
- Search term analysis
- Geographic performance data
- Device-based performance metrics
Note: This feature requires a Pro plan subscription.
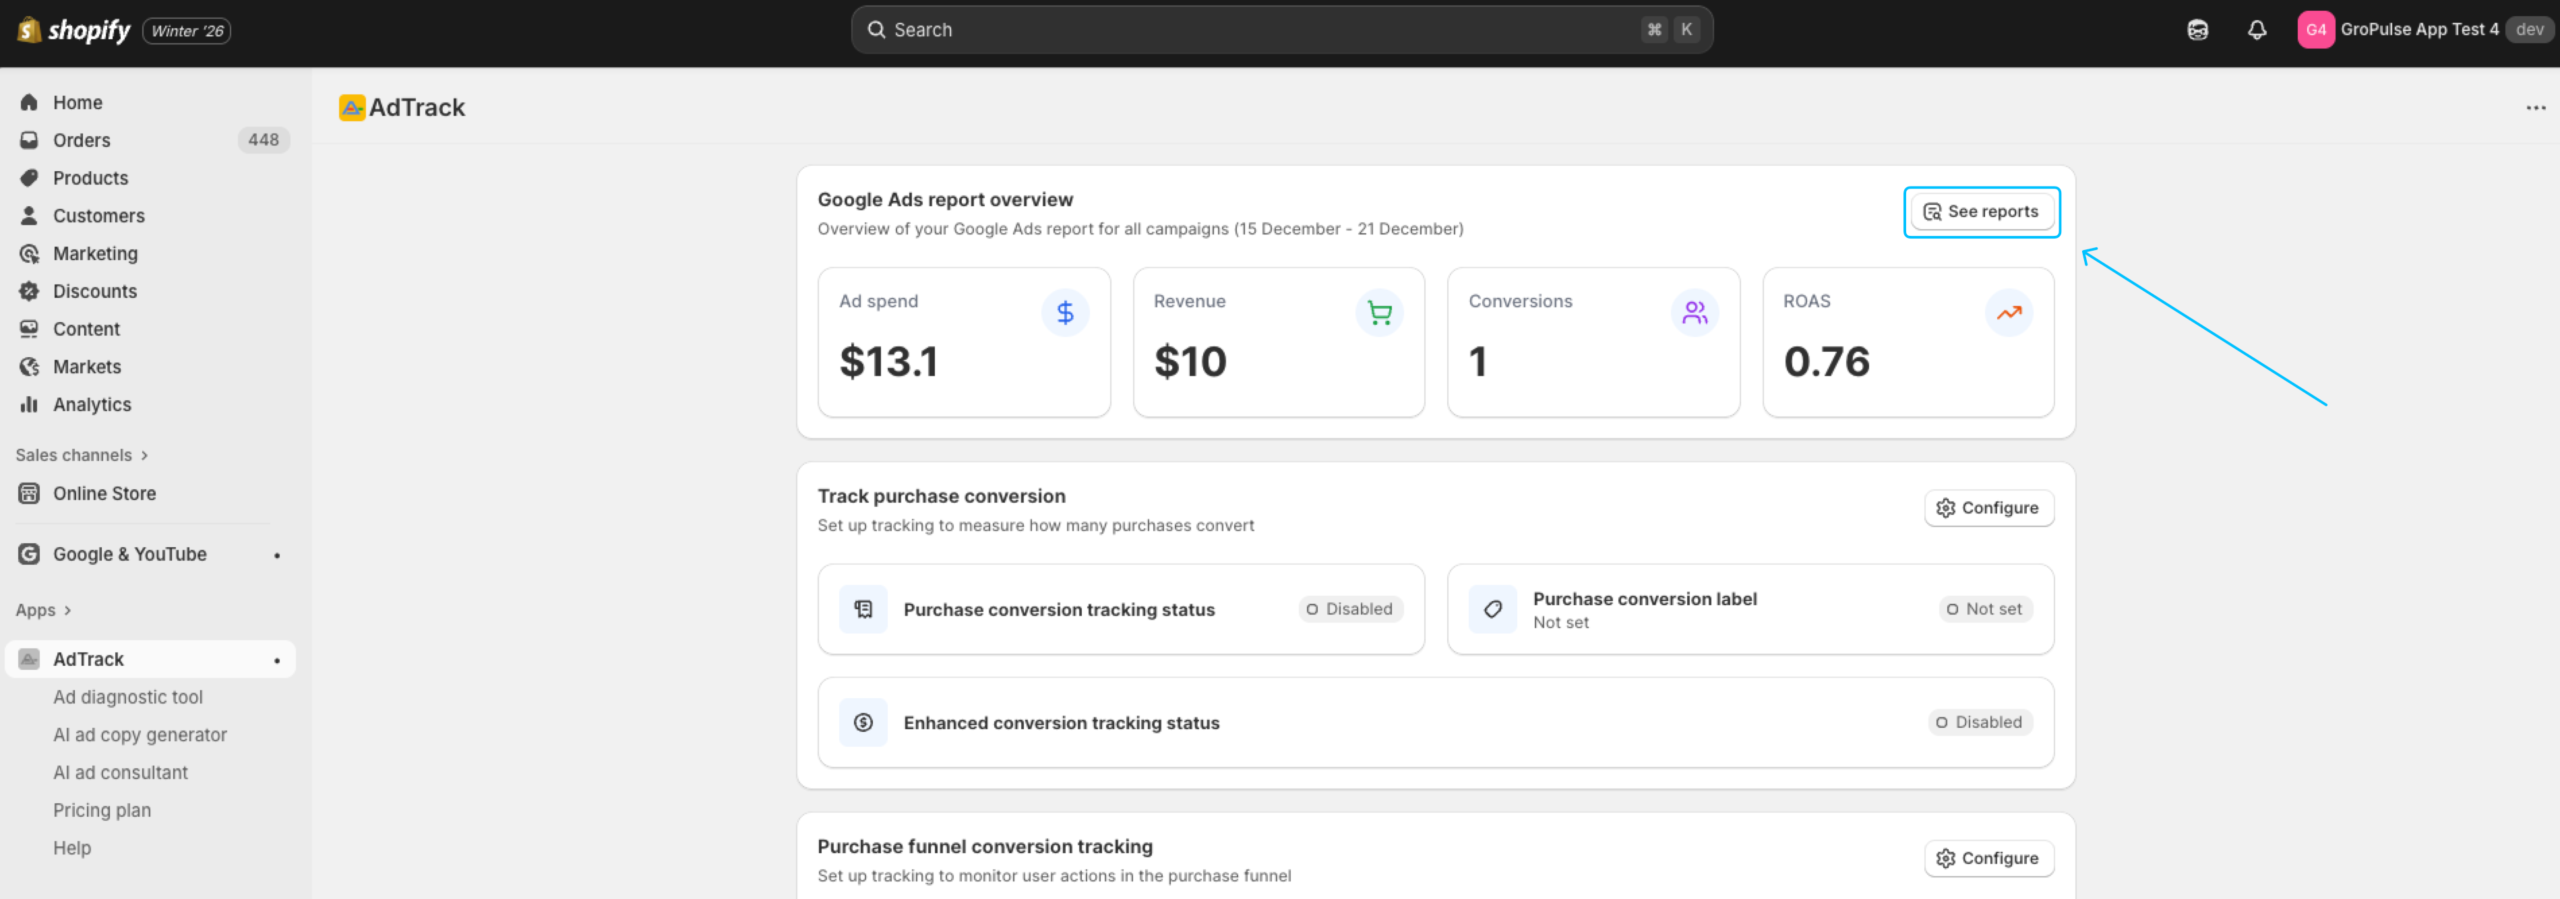
Accessing Ad Reports
- Open AdTrack from your Shopify admin
- Click See Reports from the Dashboard’s Report Overview section
Requirements
Before using Ad Reports:
- Pro Plan Required – This is a Pro-only feature
- Google Account Connected – Must have Google Ads connected
- Campaign Data Available – At least one campaign with performance data
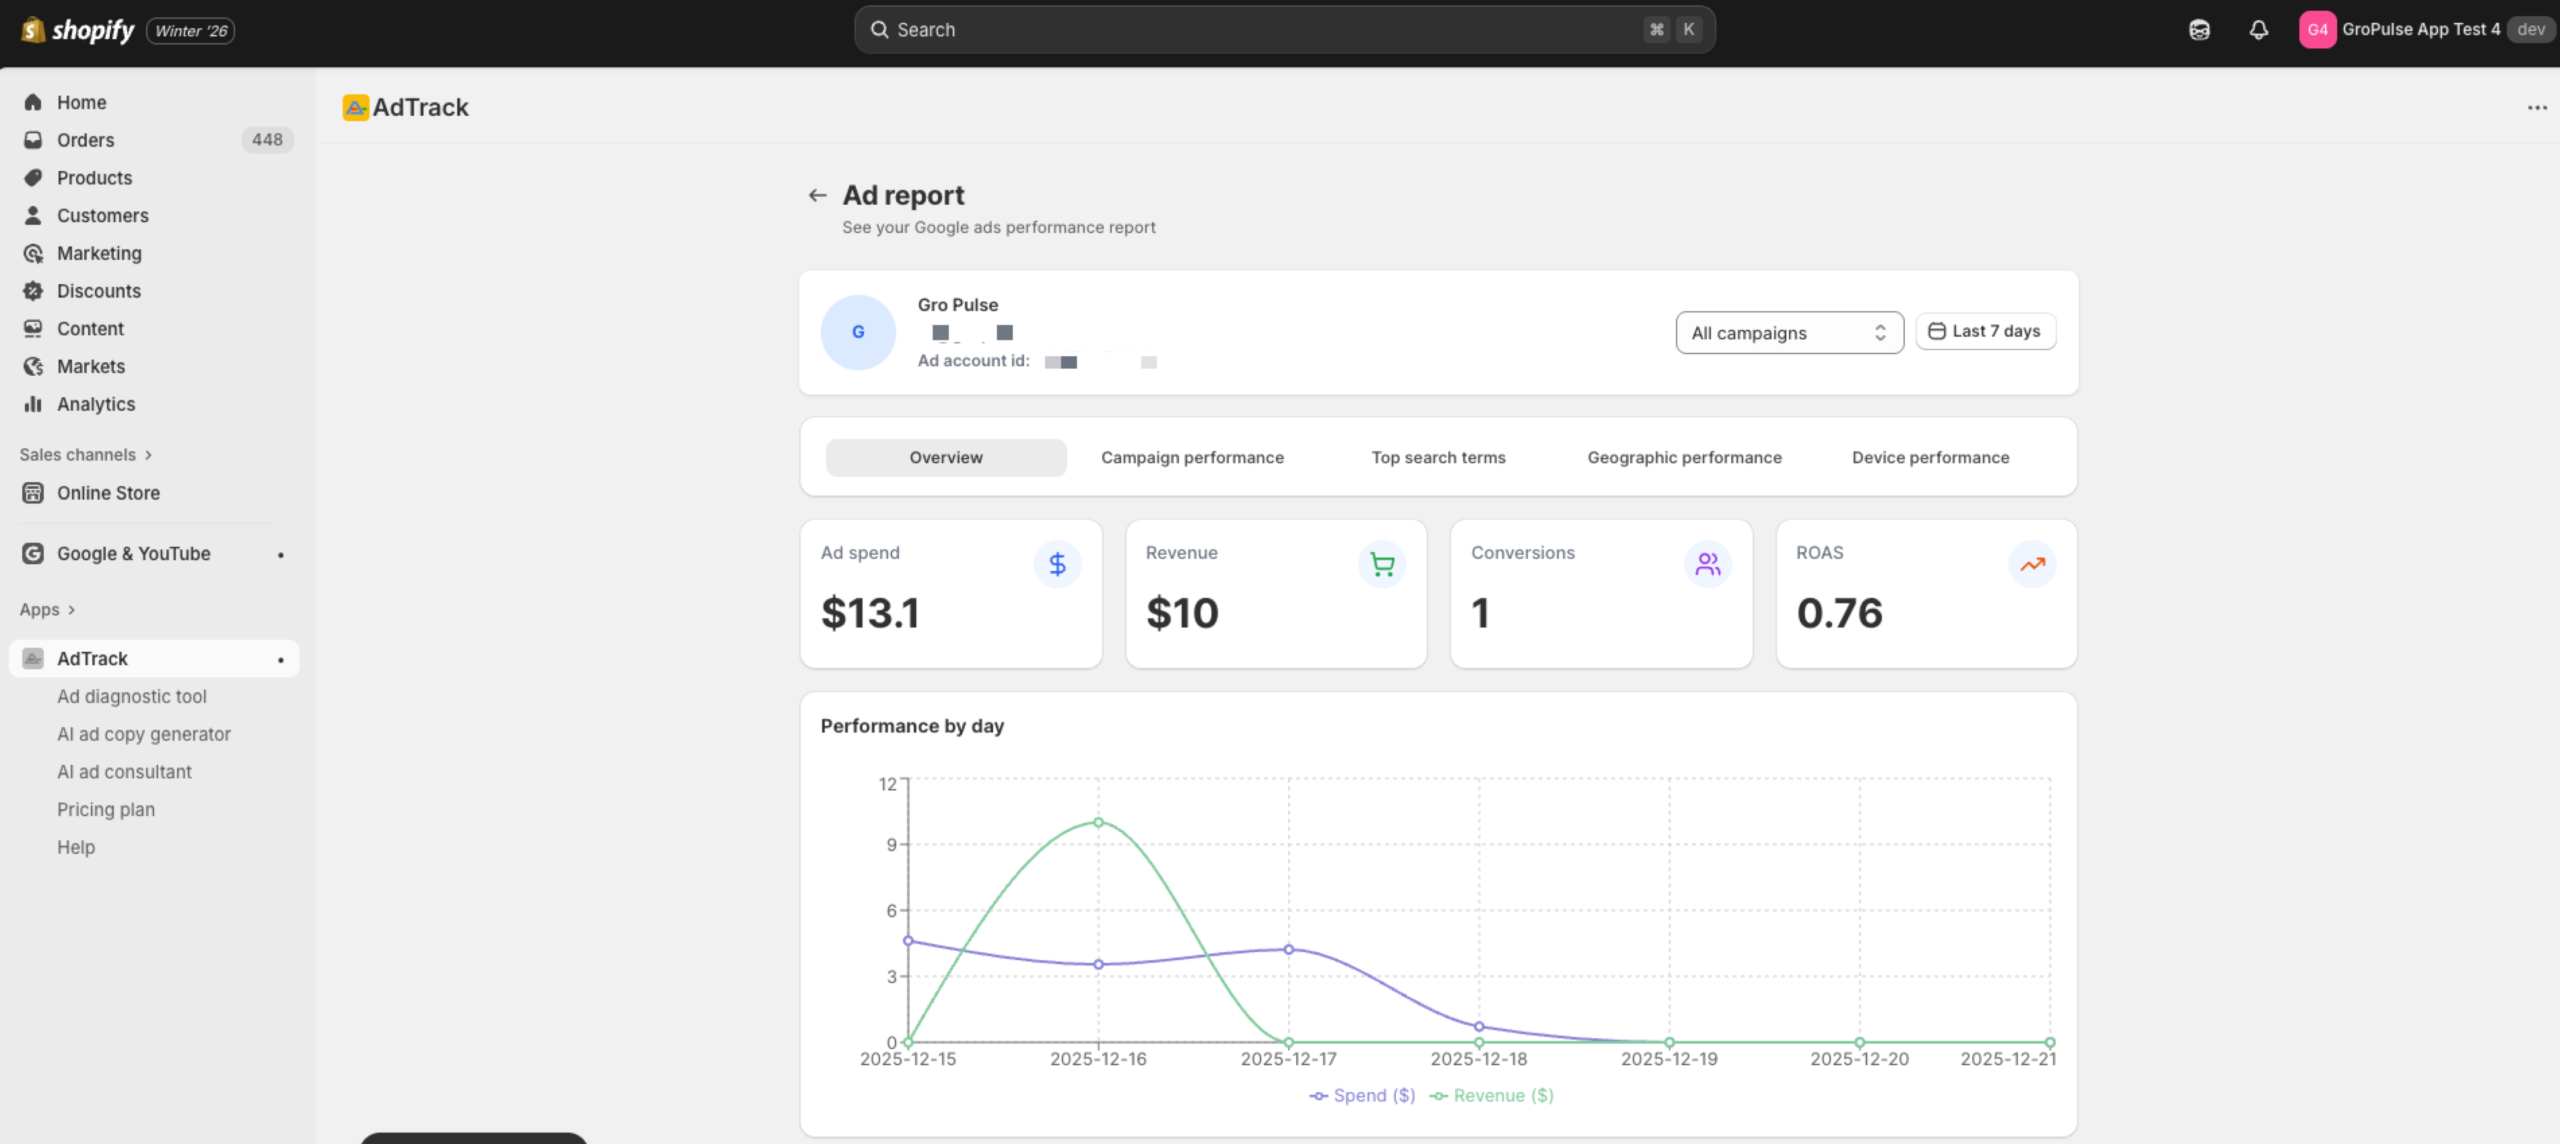
Report Header
The report header contains controls that apply to all tabs.
Connected Account Display
At the top of the report page:
- Your connected Google email is displayed
- Your Google Ads Account ID is shown
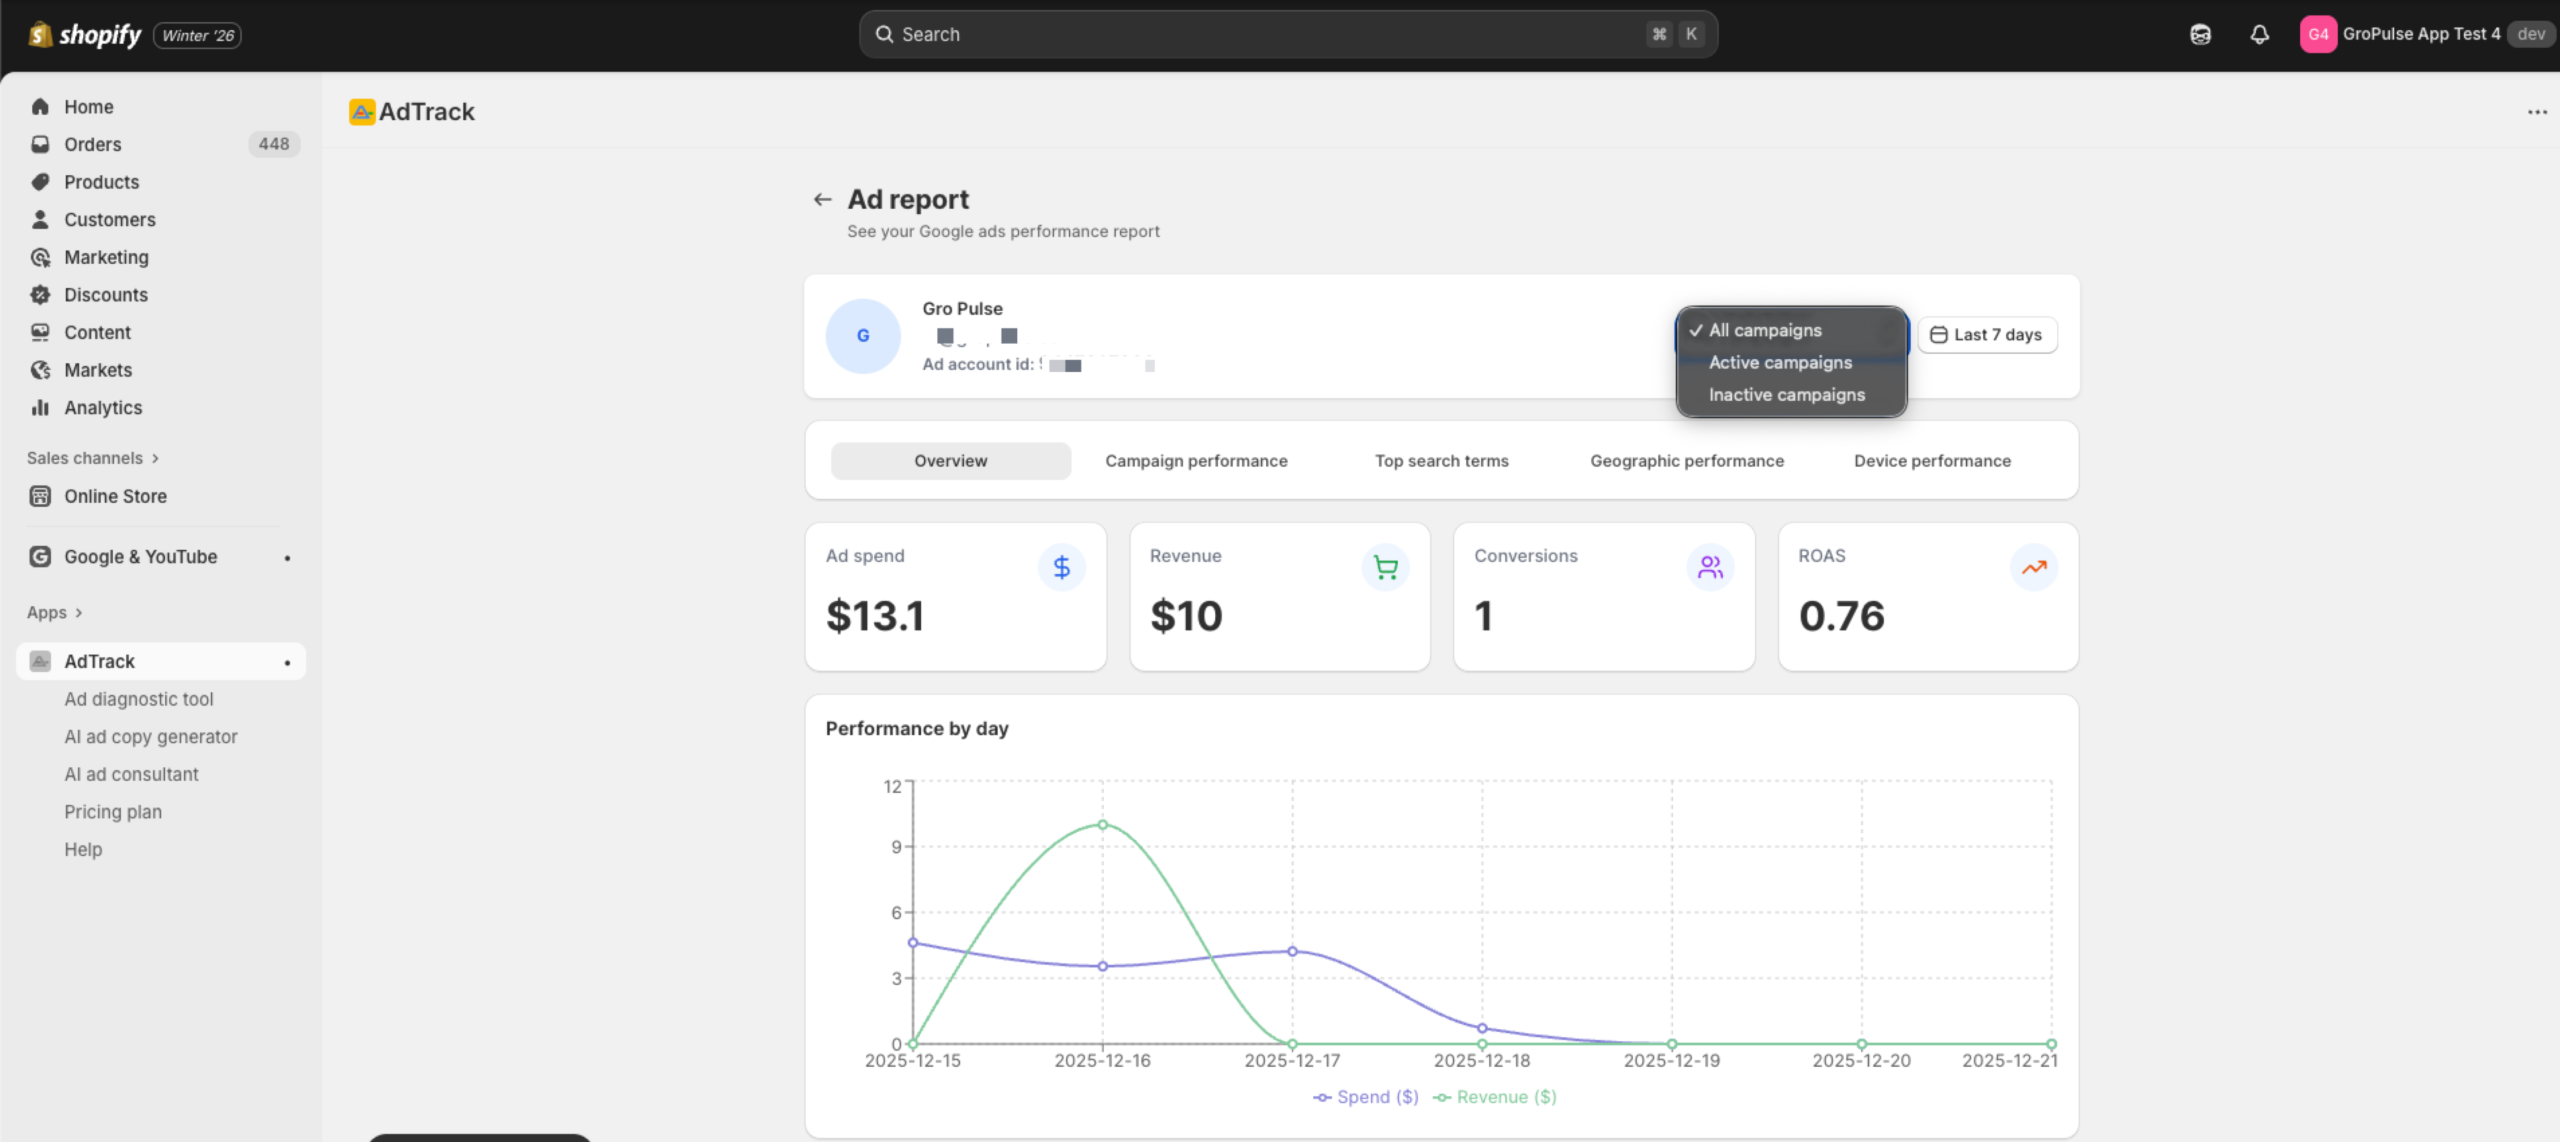
Campaign Filter
Filter your report data by campaign status:
- Click the Campaign dropdown
- Select from available options:
- All campaigns – View data from all campaigns
- Active campaigns – Only currently running campaigns
- Inactive campaigns – Paused or ended campaigns
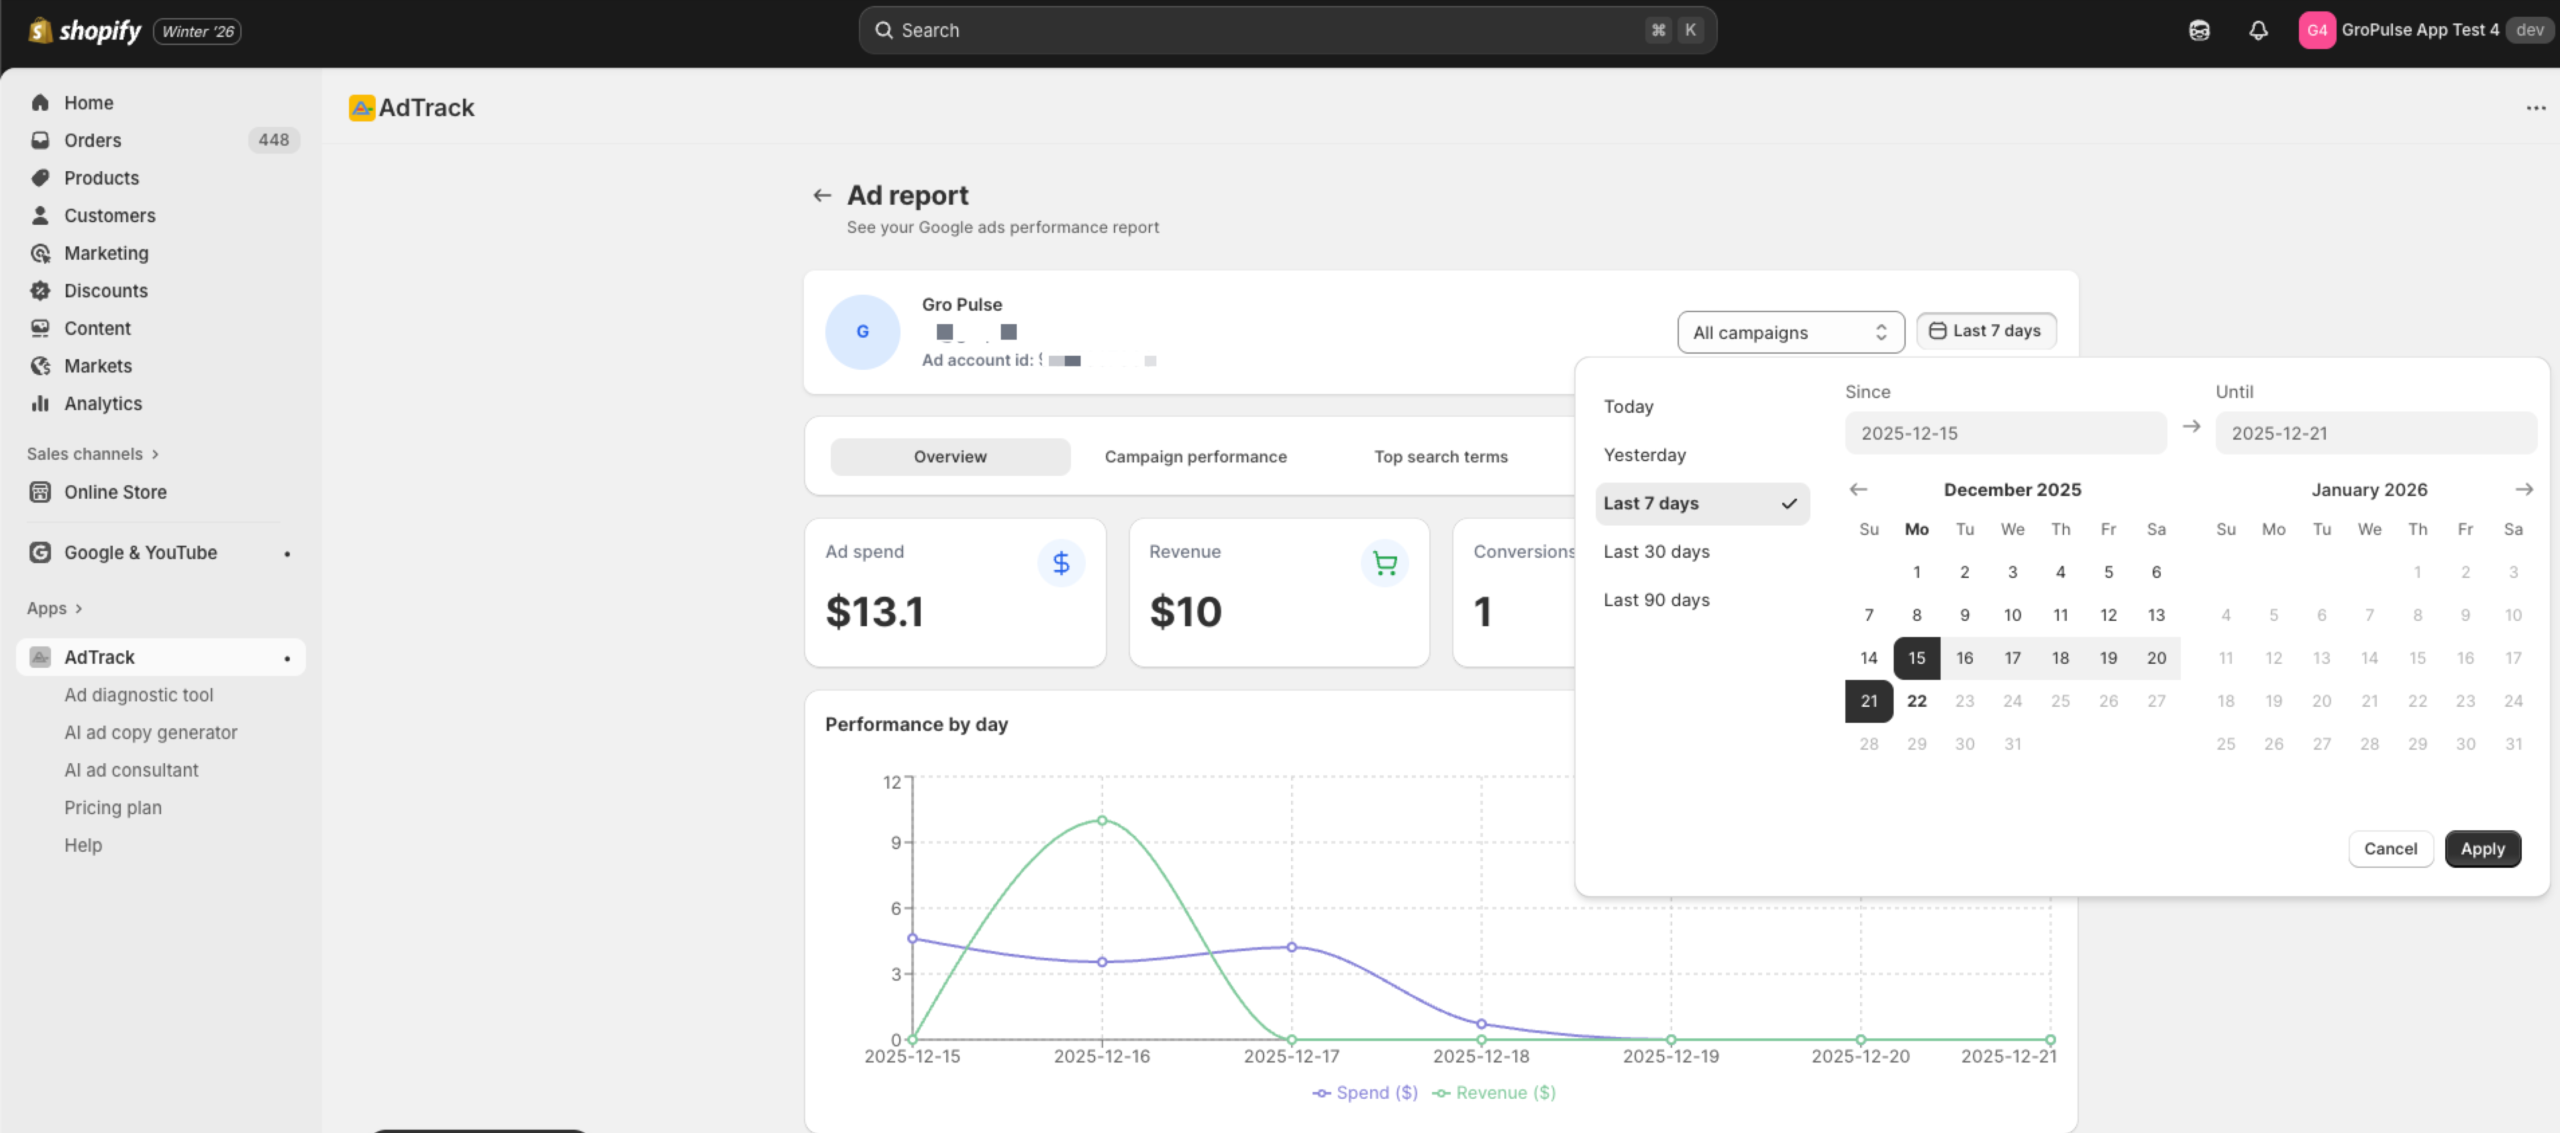
Date Range Selector
Customize the reporting period:
- Click the date range selector
- Choose a preset range or select custom dates
- The report updates automatically
Report Tabs
The Ad Report is organized into five tabs, each providing different performance insights.
Overview Tab
The Overview tab displays your key performance metrics at a glance.
Metrics Displayed:
| Metric | Description |
|---|---|
| Ad Spend | Total amount spent on ads in the period |
| Revenue | Total revenue attributed to your ads |
| Conversions | Number of conversion events tracked |
| ROAS | Return on Ad Spend (Revenue / Ad Spend) |
Features:
- Each metric shows the current value
- Performance trend chart showing daily data
Campaign Performance Tab
Analyze performance by individual campaign.
Top Campaigns Table:
| Column | Description |
|---|---|
| Campaign | Campaign name |
| Impressions | Number of times ads were shown |
| Clicks | Number of ad clicks |
| Conv. | Conversion count |
| Cost | Amount spent on the campaign |
| Revenue | Revenue attributed to the campaign |
| ROAS | Return on Ad Spend for the campaign |
ROAS Comparison Chart:
- Visual comparison of ROAS across campaigns
- Quickly identify top and underperforming campaigns
- Hover for detailed values
Top Search Terms Tab
View performance by search terms that triggered your ads.
Features:
- See which search queries trigger your ads
- Identify high-performing keywords
- Find opportunities for negative keywords
- Understand customer search intent
Geographic Performance Tab
Analyze performance by customer location.
Top Locations Table:
| Column | Description |
|---|---|
| Location | Country or region name |
| Impressions | Ad impressions in that location |
| Clicks | Clicks from that location |
| Conv. | Conversions from that location |
| Cost | Spend in that location |
| Revenue | Revenue from that location |
| ROAS | Return on Ad Spend by location |
ROAS Comparison Chart:
- Compare performance across geographic regions
- Identify your best-performing markets
- Find opportunities for geo-targeting optimization
Device Performance Tab
Understand how your ads perform across different devices.
Top Devices Table:
| Column | Description |
|---|---|
| Device | Device type (Mobile, Desktop, Tablet) |
| Impressions | Ad impressions on that device |
| Clicks | Clicks from that device type |
| Conv. | Conversions from that device |
| Cost | Spend on that device type |
| Revenue | Revenue from that device type |
| ROAS | Return on Ad Spend by device |
ROAS Comparison Chart:
- Visual comparison of device performance
- Identify which devices drive the best returns
- Optimize bid adjustments based on device performance
Understanding ROAS
ROAS (Return on Ad Spend) is calculated as:
ROAS = Revenue / Ad SpendInterpreting ROAS:
- ROAS = 1.0 – Breaking even (revenue equals cost)
- ROAS > 1.0 – Profitable (revenue exceeds cost)
- ROAS < 1.0 – Losing money (cost exceeds revenue)
- Higher ROAS – Better performance
Using Report Data
Optimization Opportunities
Use the reports to identify:
- Top Performers
- Campaigns with high ROAS for budget increases
- Locations driving profitable conversions
- Devices with best conversion rates
- Underperformers
- Campaigns needing optimization or pausing
- Locations to exclude or reduce bids
- Devices requiring bid adjustments
- Trends
- Performance changes over time
- Seasonal patterns
- Impact of recent optimizations
Actionable Insights
Based on your data:
- High ROAS campaigns – Consider increasing budget
- Low ROAS campaigns – Review targeting and ad copy
- Strong locations – Increase geo-targeting
- Weak locations – Add bid adjustments or exclusions
Best Practices
- Regular Review – Check reports at least weekly
- Sufficient Data – Use at least 7 days for accurate insights
- Act on Insights – Make optimizations based on data
- Document Changes – Note what adjustments you make